Here is another way at looking at the data generated by Livingston & Penn (thanks to Leif Svalgaard). Also in this article there are many questions that need to be answered in relation to the measuring practice employed by Livingston & Penn.
For those not acquainted with Livingston & Penn they have been recording the magnetic intensity and light contrast of sunspots for SC23 and beyond, many people daily discuss the L&P effect as some sort of unknown force directing our Sun. L&P believe the downward slope (dropoff in overall magnetic strength) will continue until no spots are seen at all around 2015 as the sunspots will go below 1500 Gauss and not be visible. I am somewhat skeptical and expect to see a slight rise in the Gauss strength as we approach the peak of SC24 which will be very weak.
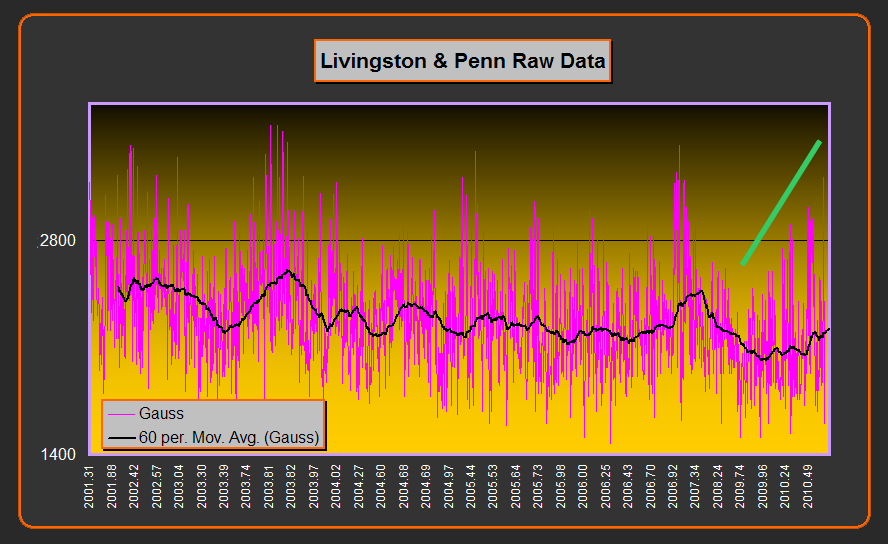
I put the data through excel and its a bit rough and ready as the timeline is not to proper scale, but the trend is clear. The trend may be clear in regard to a recent recovery, but I have serious doubts about the base data including the validity of the pre 2001 data which I will expand on. The high readings are on the increase with many sunspots during Jan-March not being measured including the very large groups 1040, 1045 & 1054. The larger groups are more likely to achieve higher readings. Through no fault of L&P they cannot guarantee telescope time during these events, but even when they do have good telescope time and a good group are they really giving a good account of the sunspot potential?
L&P in their paper propose that sunspot Gauss readings do not follow the normal 11 year sunspot cycle, I am not confident in their analysis and predict the L&P base data does not represent reality and SC24 will show an upswing in Gauss readings as the cycle progresses.
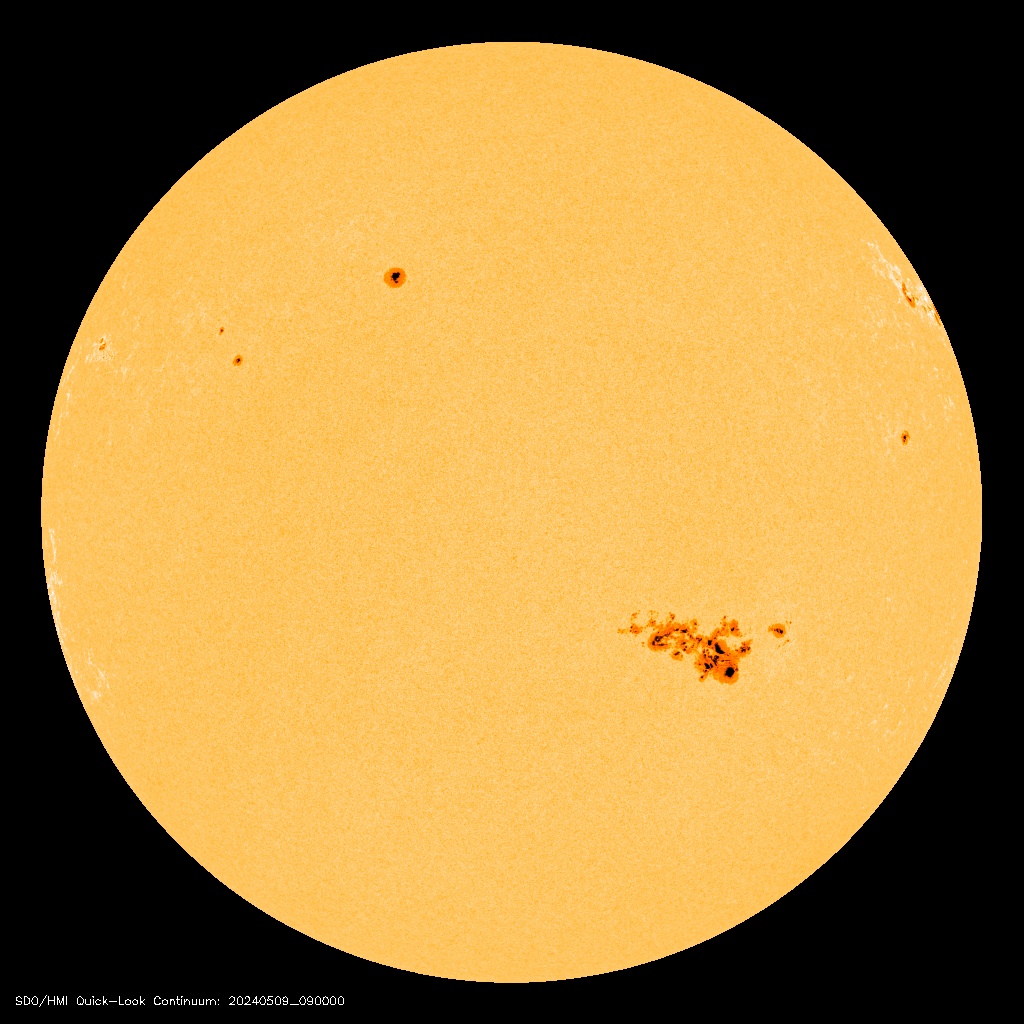
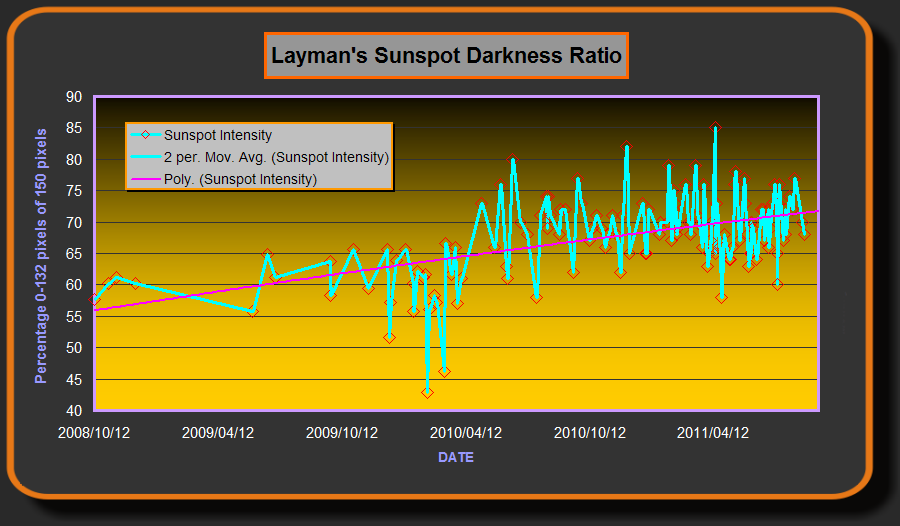
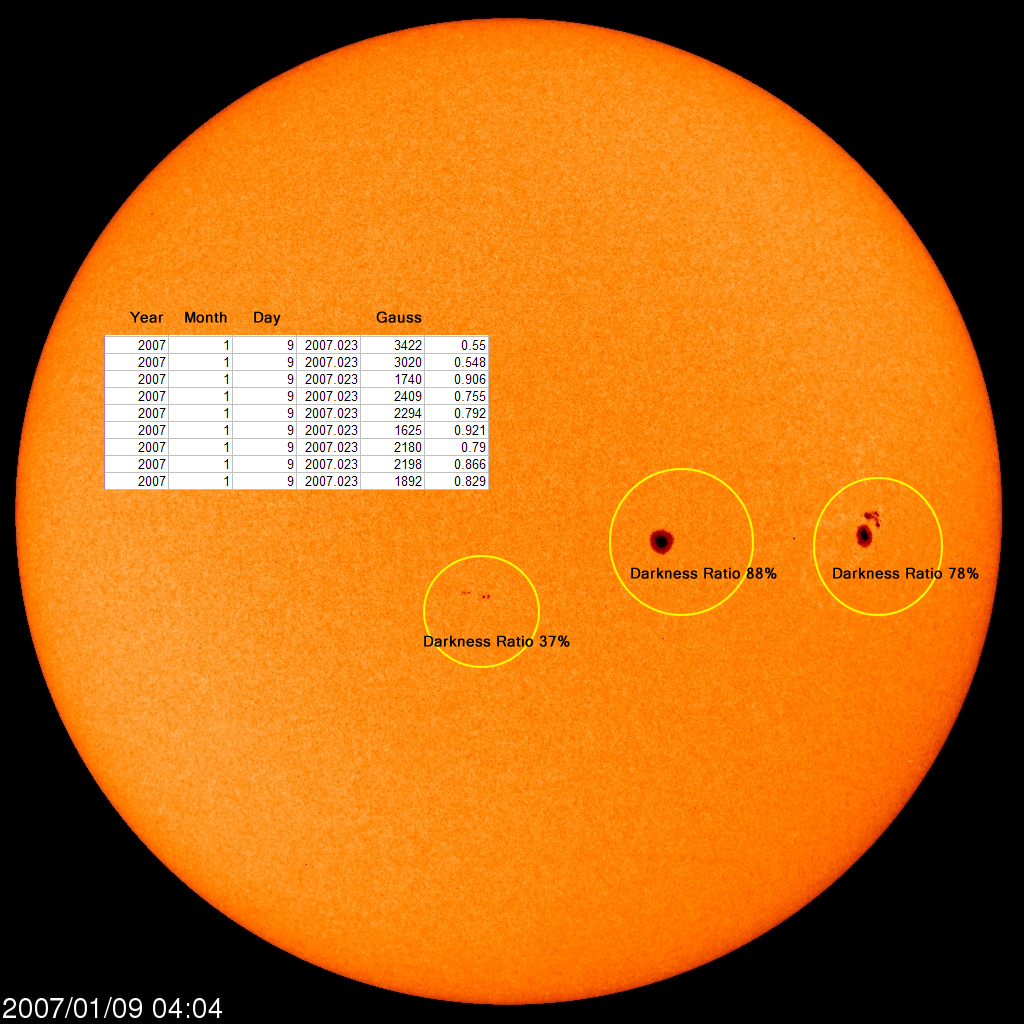
I measure the darkness ratio of all spots at their peak, this method counts how many pixels are between 0-34 in the green channel and compares that with the balance of the pixels counted in the spot ie 35-70 in the green channel. 0 is basically black so this method is reliable for determining the amount and ratio of dark pixels in a spot (darker spots have higher magnetic readings). As can be seen below over SC24 there is no trend downwards. I believe the high values are the ones to watch in both graphs as small sunspots will nearly always deliver low readings. The SOHO Continuum images are only available back to 2006, but big groups occurring in that era have darkness ratio's in the low 80's. One of the highest readings taken 2007 Jan 9 with a reading of 3422 gauss measures 88% on the Layman's darkness ratio scale, showing the calibration between the 2 methods is good. Note: older SOHO values quoted.
I believe the current Layman's data severely challenges the method put forward by Livingston & Penn.

The above graph is maintained by Leif Svalgaard and uses the same L&P data. The bottom series is the gauss data with the top series being the contrast ratios. Leif uses an averaging system that looks very different to the raw data.
Lets look (below) at some of the raw data and compare it with a SOHO image taken on the same day. The 9th Jan 2007 is a good place to start as it shows both high and low readings on the same day (this looks to be a trend on the post SC23 max data). The averaging method used by Svalgaard and Livingston & Penn looks to use a binning system that mixes sunspot records together. Also during a day with multiple sunspots we can have a situation where large spots are recorded along with small spots, which can severely affect the average. I personally think this is not a reliable method to test the magnetic strength of the Sun, and some sort of minimum sunspot area should be agreed on. Should spots without an umbra (dark centre) be measured?
Another issue is the records taken before 2001, if you look at the data the samples taken are extremely sparse and only look to include high values. In my opinion there is not enough data taken before 2001 to assume that the magnetic strength does not follow the normal 11 year cycle as L&P suggest. The records before 2001 should not be included.
click for a larger image
Below we move closer to today as we look at March 30 2010 where only 4 readings were taken (now more records have turned up, there are now 6 readings?). L&P began reading these groups on the 27th. There are 2 low measures of 1540 & 1759, I ask where do the low readings come from? 1500 Gauss is considered invisible. Is there a standard which controls what parts of a group can be measured? If not we could measure every speck in a group which would drown the high readings which is what looks to be happening, this is another case of speck counting obscuring the record. The early readings before 2001 did not have these low readings mixed in, the method back then (Solanki) was to only measure large spots. With the scant recording before 2001 along with the different measuring practice it is impossible to determine a result before SC23 max.

The National Solar Observatory made some interesting comments re L&P in their 2009 annual report. They do not see any decline in spot magnetic strength but suggest we are seeing a higher proportion of weaker spots, coming about from measuring the increasing proportion of specks and pores that have occurred on the downslope of SC23.
http://www.nso.edu/general/docs/APRPP_2009-10.pdf

BUT WHAT ABOUT F10.7 FLUX?
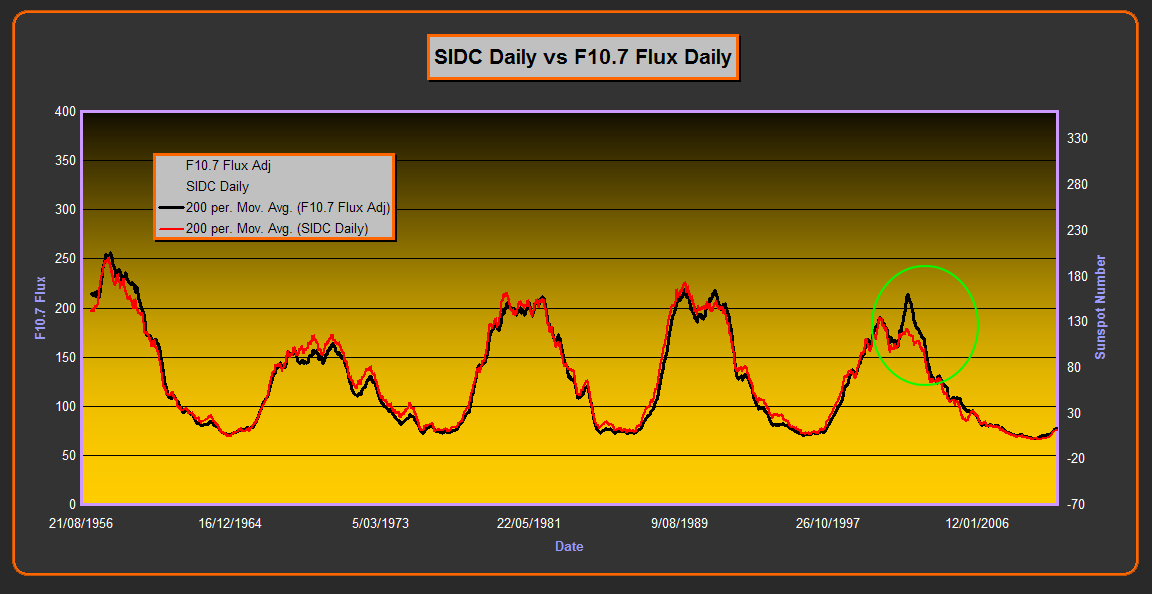
The F10.7 Flux values have aligned quite closely with the sunspot number since about 1950. SC23 has seen a deviation of that alignment and some attribute this move to the L&P Effect (this deviation is currently under challenge...more to follow). But there are many sources of F10.7 Flux and if one of those sources varied it could be responsible for this deviation. Data source www.leif.org

One of the main players is Plage or the bright areas that need not be sunspot active.While researching the EUV component of the TSI values I noticed that EUV and Plage were very closely connected. Good evidence showed a jump in EUV on the initiation of a large sunspot group which was followed up on the next 2 rotations of the same area even though there were zero sunspots on the latter rotations. The last 2 rotations were purely large plage areas.
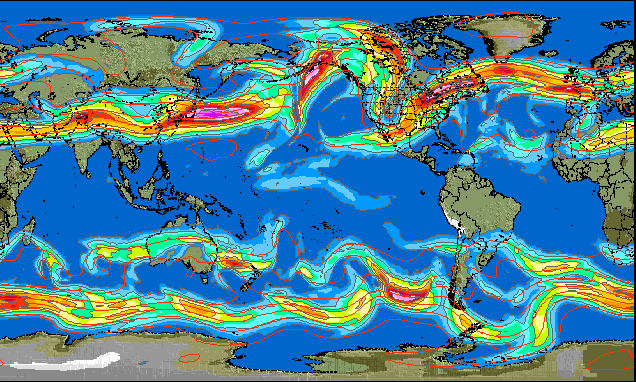
Below is a graphical overlay of SC23 EUV values and F10.7 Flux, the correlation is very close suggesting F10.7 is much more aligned with Plage activity than sunspot activity. Could an increase in recent Plage activity explain the F10.7 Flux/SSN deviation?

Click on image for full size view.
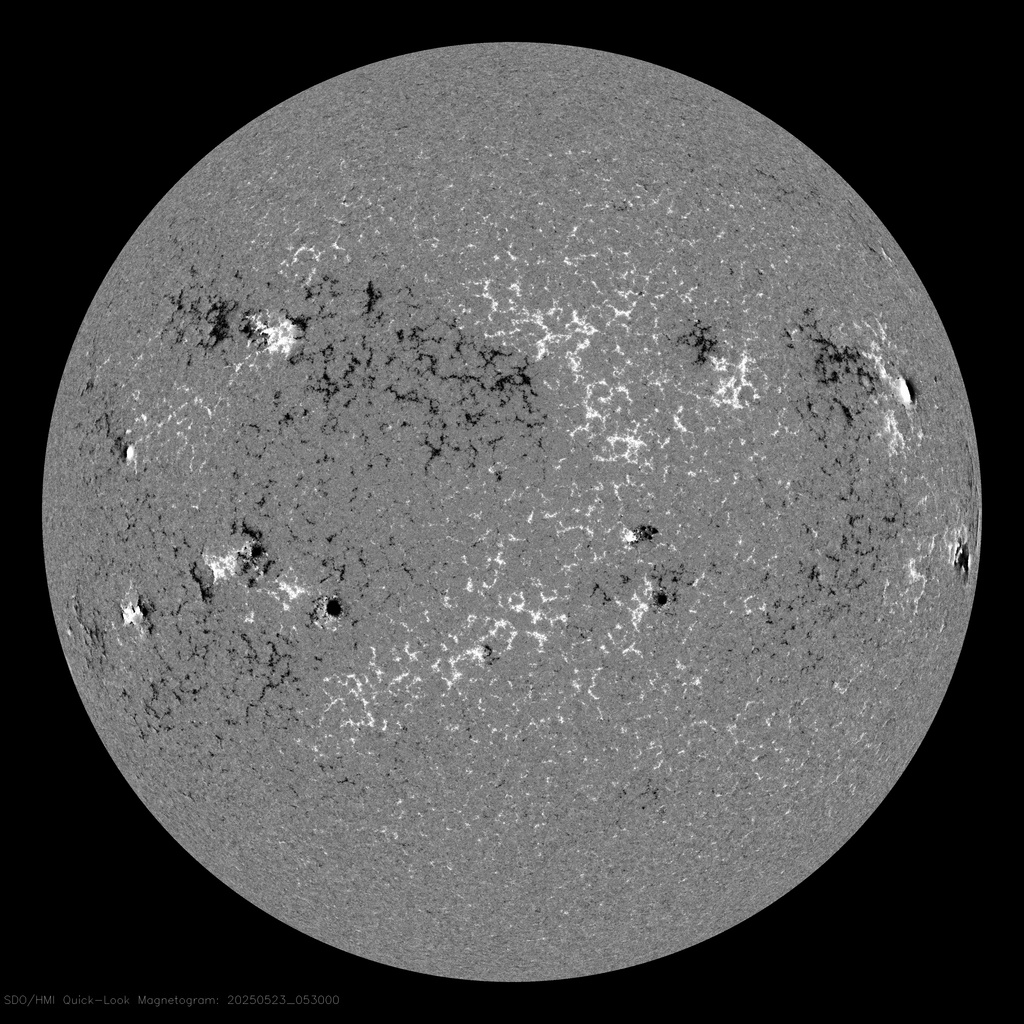
I decided to spend a day looking at the data. I picked 2 spots in the record where there is high flux count, the first 28/08/1999 where the flux and Sunspot record are close on Dr.Svalgaard's comparison graph and the other on 28/09/2001 where a large divergence is shown. I meticulously went over the SOHO continuum and magnetogram images looking for a change in relationship between the plage area's and sunspot areas. Each image had every relevant pixel counted and there looked to be no change in the relationship. I next checked the sunspot counting methods and they too looked good with the usual difference between NOAA & SIDC.
Then I researched how Dr. Svalgaard arrived at his F10.7 Flux values to find that he has merged 3 datasets to form a composite series. http://wattsupwiththat.com/2009/05/14/the-solar-radio-microwave-flux/
The longest continuous dataset for F10.7 is from 1947 produced in Canada (also in 2 parts) is adopted by most, the two other Japanese records that split the time frame are higher and lower than the Canadian record.
If I plot the Canadian record (adjusted for Earth's elliptical orbit)against the SIDC daily record I get this.

Click on image for full size view.
I also obtained the monthly sunspot data from NOAA along with the Canadian monthly F10.7 Flux values, the data only goes back to 1991 but a comparison is possible. The NOAA values matching the F10.7 values suggesting the SIDC apearing to be overcounting from 1996-2001.

Ken Tapping has performed some analysis on this topic and shows that there is some divergence between flux and sunspots during SC23. http://helios.swpc.noaa.gov/sww/2010/friday/SWW_2010_KFT.pdf He uses the standard Canadian flux data and shows plots describing this variance. The difference in this analysis is he is not showing a trend change as per Dr. Svalgaard but an overall difference covering the entire cycle. If I smooth the standard data further a large anomaly is apparent around 20001/2002 and then the two measures come back together. The reason for this divergence could be high flare activity at cycle max or one of the other factors that drive F10.7 Flux, it is more of a one off event rather than a gradual diminishing of sunspots.
My thoughts are that F10.7 Flux is produced by many solar functions that are not connected directly to the sunspot count. It would seem impossible to achieve an exact match, at best a similarity in trends is expected.
Overall there are a lot of holes in the L&P effect, the original paper was rejected by Nature but later published in Astrophysical Journal Letters (Penn and Livingston 2006, v649, L45). What we are left with is the very strong possibility that the sunspot magnetic strength simply follows the 11 year sunspot cycle. For a copy of the raw data and graph in spreadsheet form CLICK HERE