Carl is no longer with us, but he has certainly left us with a legacy. Back in 1965 Paul Jose was one of the first to link solar modulation with planetary movements. He discovered that the planets roughly returned to the same position every 178.8 years (My research suggests 172 yrs). Jose's paper included a very rough solar radius graph which showed some modulation but was difficult to draw from. Later Theodor Landscheidt wrote many papers using a similar principle but mainly relied on solar torque graphs which ranged over long time periods. Theodor also focused on the zero crossings or when the Sun returns to the centre of the solar system, which in my opinion is not the crucial stage but happens close to grand minima. Landscheidt predicted a Grand Minimum to start at 1990, peak around 2030 (the latter 2030 might be late, if the current trend continues) and extend out to 2070...Those dates are derived from the zero crossing method which incorporates an extreme in solar torque measurements.
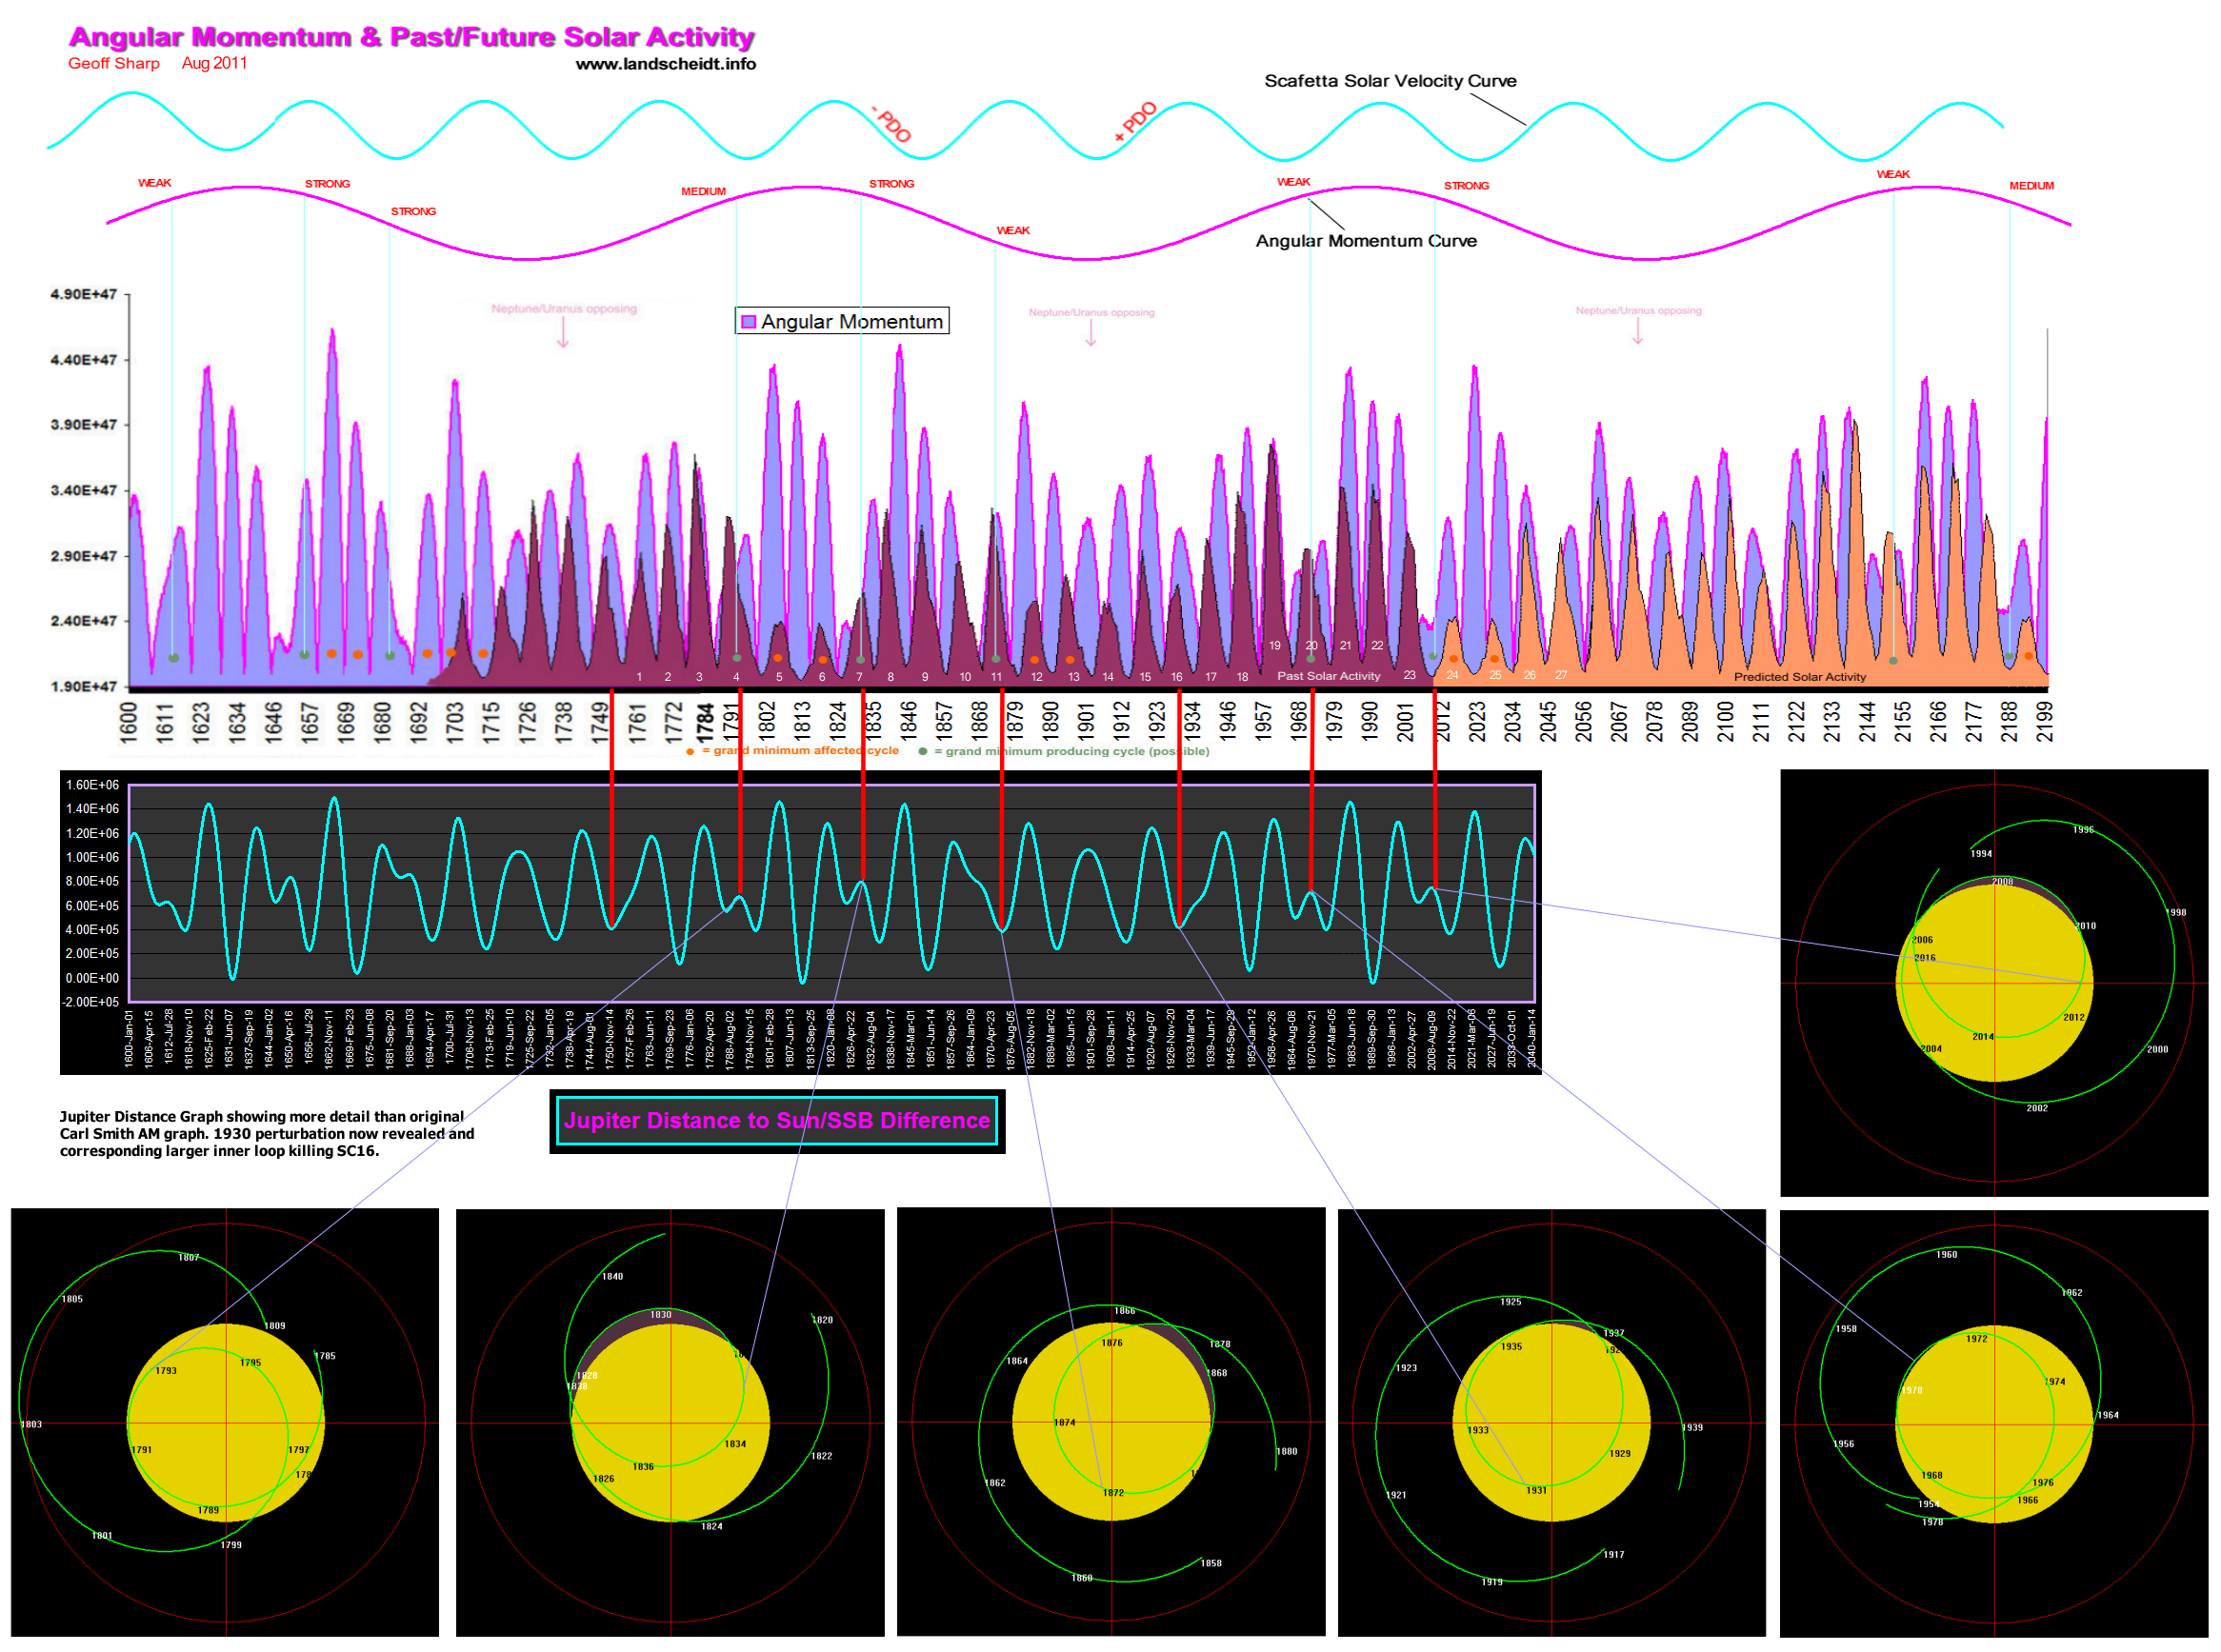
Then Carl Smith in 2007 using JPL data and his own programming skills plotted the Angular Momentum of the Sun. This graph I believe is the Rosetta stone of solar science.
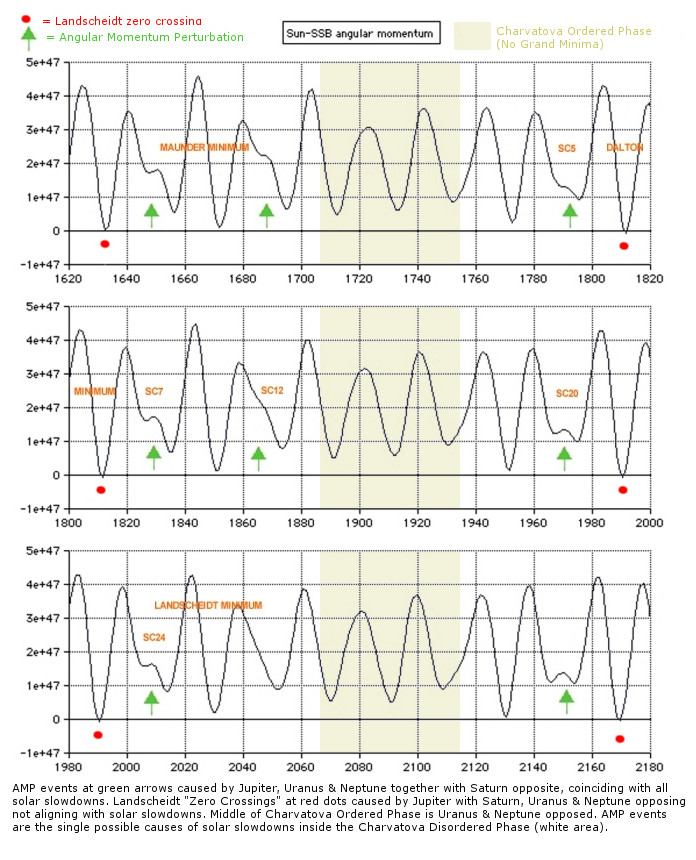
Carl's original graph did not have the green arrows, but instead he displayed red dots when the curve reached zero. (both Carl & Landscheidt concentrated on the negative angular momentum as the graph goes through zero). Link to Carl's original article HERE.. The solar disturbances occurring at the green arrows is a new discovery quite different to the Landscheidt theory.
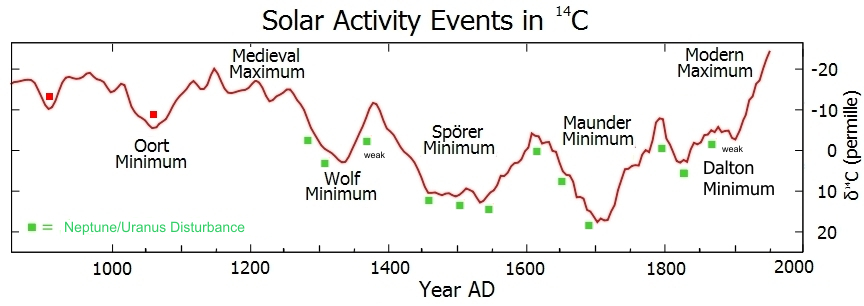
Carbon 14 graph from Wiki showing correlation with Carl's graph. Green squares corresponding with the green arrows.
Carl's Graph was produced in 2007. Around 12 months later I stumbled on his graph while doing some ENSO research and noticed the "camel shaped humps" at the green arrows (green arrows added later), this is the point of divergence and the beginning of my research.
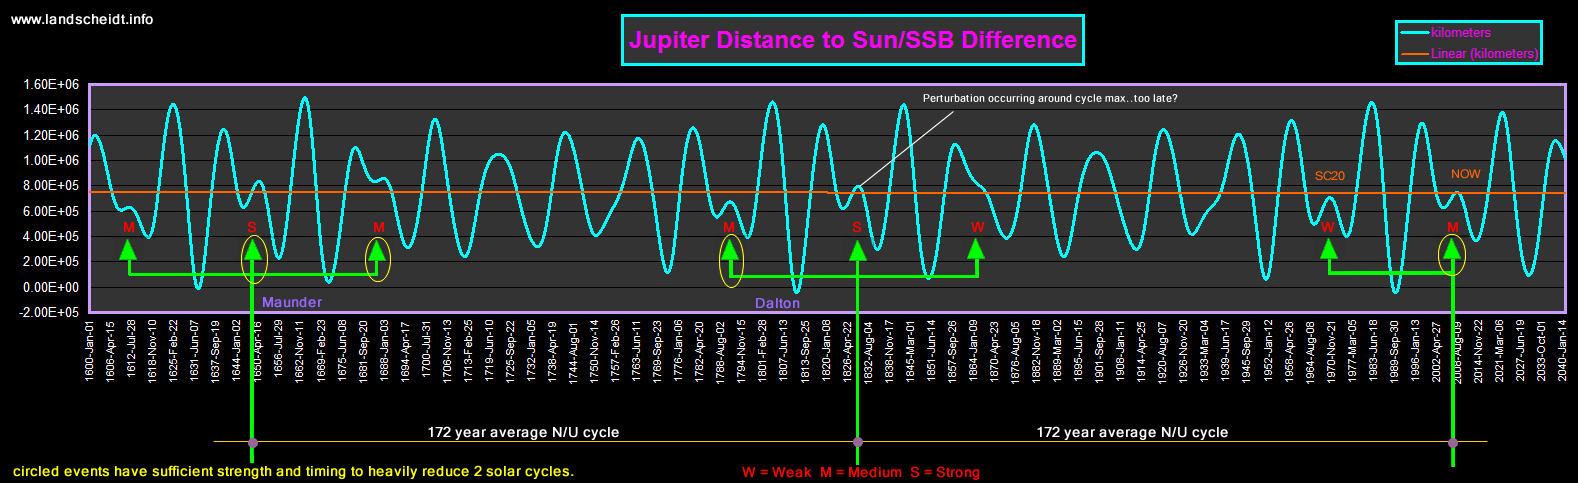
The humps or disturbance to the normal pattern also looked to line up very accurately with prior slowdowns of the Sun for the last 400 years. I later discovered this to be true for the last 6000 years. By studying the shape of the hump and measuring the Saturn angle we can now also quantify the severity of the solar downturn which lines up with the 11000 yr 14C (solar proxy) records in timing and strength, I call these humps the AMP event which stands for Angular Momentum Perturbation. Further research established another correlation, I checked the planetary position at the point of disturbance and noticed a recurring pattern. Every time there is a disturbance on Carl's graph we have the same planetary position. 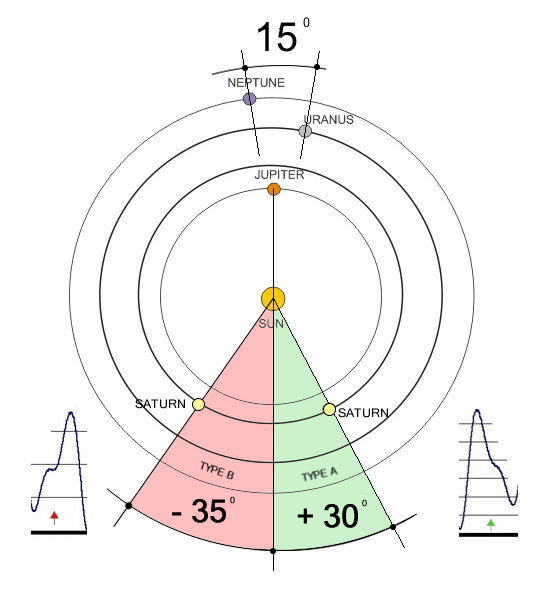 This position is Neptune, Uranus and Jupiter together with Saturn opposing, this only happens on a cycle around 172 years average, which now laid the foundation for solar modulation planning. In addition it also became obvious that Angular Momentum (AM) was responsible for the strength of the solar cycle, the AM curve very closely matches the sunspot curve which now allows us easily to predict modulation strength for the next 200 years and more. The AM graphs serve as a marker and AM is not a driver in itself, the background forces are gravity, rotation, torque and velocity. There is one fact that cannot be argued against, the position of the planets as just described radically changes the path of the Sun around the Solar System Barycenter (SSB), this also coincides with all solar slowdowns. Only this planetary position can cause this radical path change.
The oncoming Grand Minimum will prove Carl's graph is the key to solar activity, which will radically change the solar scientific arena. It will take time for Angular Momentum Theory (AMT) to take hold, but the house of cards of the last 50 years of solar science will eventually crumble, showing us all how little we really know.
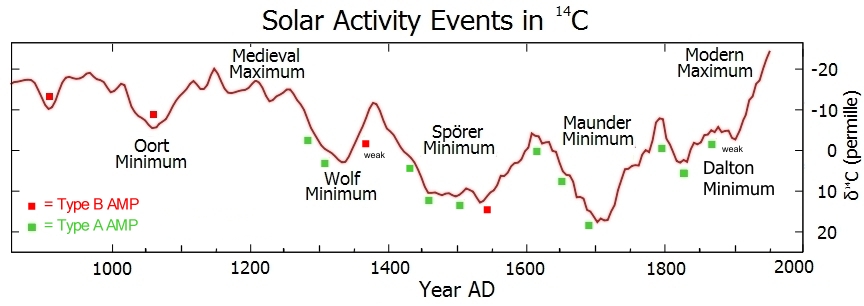
Below is a new version of Carl's graph that uses different data that slightly enhances the AMP events at the green arrows. Click on the image for a full size view.

Be sure to visit our sister site that has more new research in the Planetary Realm along with a full archive of Dr. Landscheidt's & Carl Smith's work http://landscheidt.wordpress.com/
___________________________________________________________________________________________________
Addition Keystone graphs produced after paper publication: