What modulates our Sun? The majority of science work on the principle that the Sun is self modulating and each solar cycle is a product of a random number generator. There are others that suspect the Sun is modulated by the planets with a special emphasis on Uranus & Neptune. Thanks to Carl Smith who has recently left us we have new knowledge that significantly adds to Jose, Landscheidt & Charvàtovà's work.
TSI or Total Solar Irradiance is often displayed as the posterboy for the AGW crowd. Their tired argument states that with only .1% variance in TSI over the solar cycle TSI cannot have a measurable impact on the Earth's climate, and is not responsible for any rise in global temperatures.
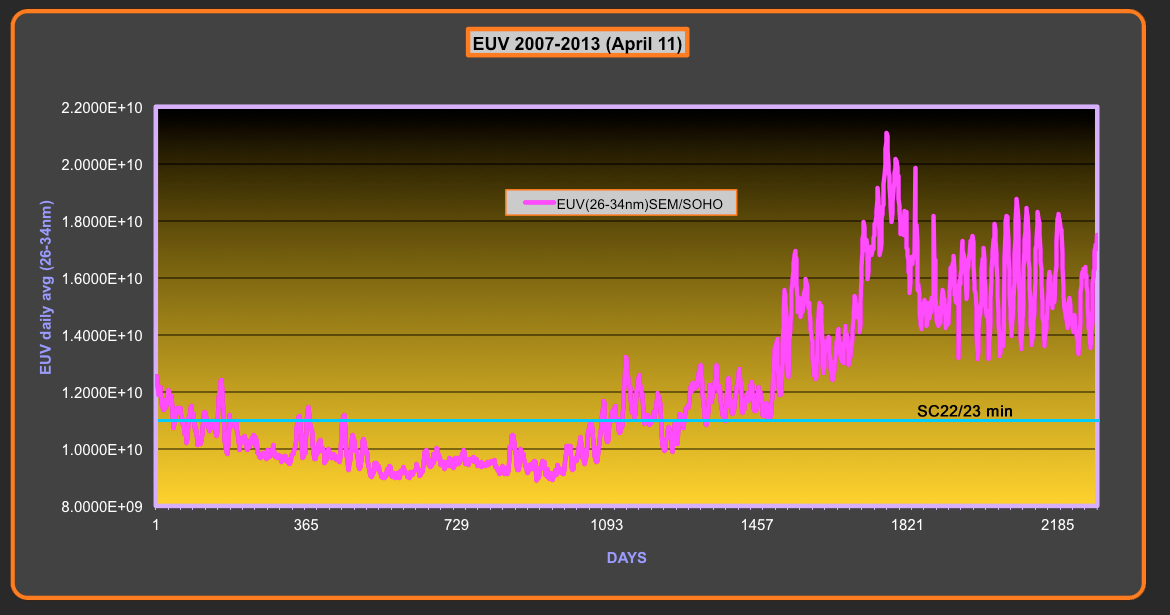
But wait...there is more than just TSI emanating from our Sun.Graph updated to April 11, 2013.
Even if TSI had zero variance in output it could still be modulated by cloud cover, something the IPCC aligned scientists forget to include in their models, some suggest greater lower level cloud cover will shield our oceans from heat uptake. Outside of this the Sun does more than just provide heat, it provides the solar wind of charged particles which include magnetic properties that shield our planet, as well as the all important UV rays which are now gaining prominence in climate research. There is said to be a 2 fold effect, our ozone layer is maintained by solar UV production and is currently at a very low level, also there is speculation that UV radiation has a warming effect on the higher atmosphere which can permeate to the troposphere with changes to pressure cells that can alter cloud makeup and recently this warming has also been linked to negative atmospheric oscillations in the northern hemisphere (AO & NAO). A NASA paper written by Schmidt and Mann (who would have thought) HERE. When we add to this the Svensmark effect which is a direct result of the solar wind speed strength, and we start to see a few variables that might make up part of the big picture.
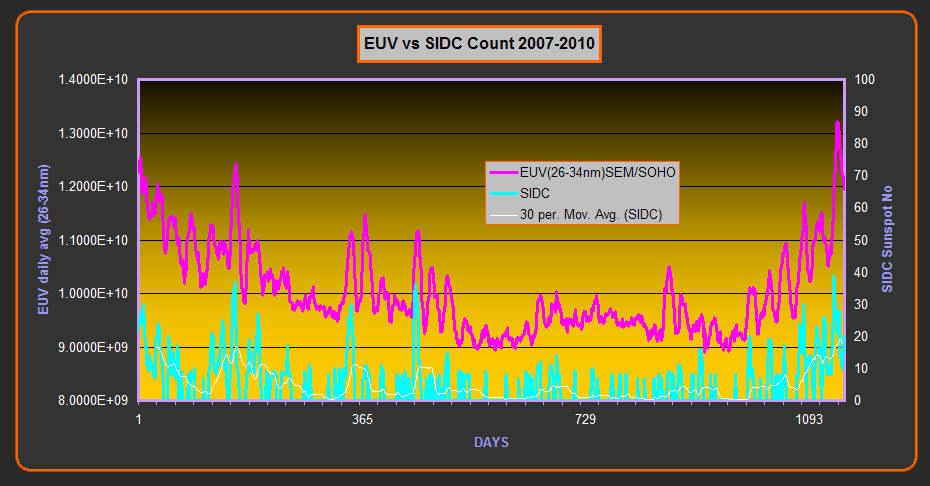
Lately via the Layman's count I have been watching the solar wind speed and how it varies from solar sunspot activity. I will also be watching the UV metrics over SC24. In particular I will be graphing the EUV (extreme UV 26-34nm) that has variations much larger than TSI over the solar cycle. Also of interest since June 2010 is the dominance of Negative Sunspots that display very low or negative EUV values. EUV is thought to be a product of faculae or plage regions which are brighter areas present around sunspots or indeed existing without sunspots. In the graph below I have compared the SIDC sunspot count with the EUV readings taken from the CELIAS/SEM experiment on the SOHO satellite. While the plots roughly follow each other there are distinct times when they are not in sync.
Click on the graphs for a full size view....above graph updated to 26th Feb 2010. SIDC figures updated at end of month.
The Layman's Count does not go back far enough for a comparison like this and the SIDC count probably represents a better marker for solar activity. The Layman's count is about comparing the current predicted grand minimum with the previous.
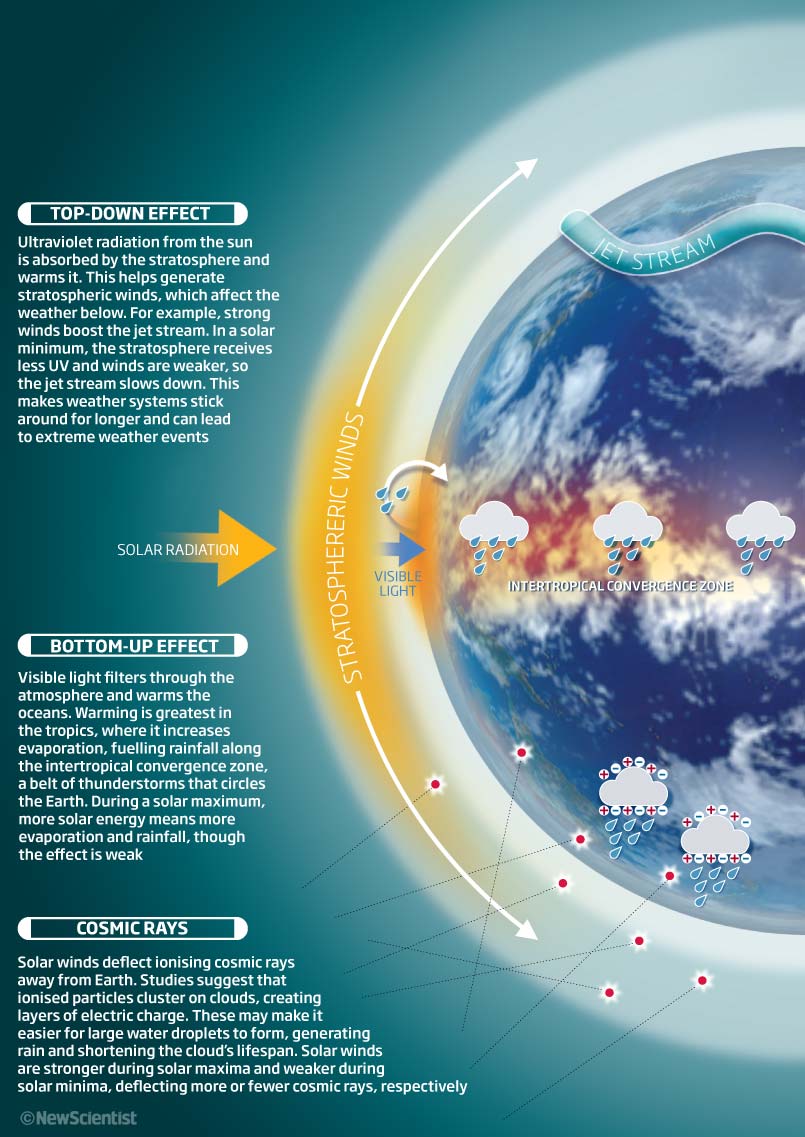
A recent report from NCAR that studies the effect of differnet ozone levels states:
"Top Down – Bottom up
In order for such reinforcement to take place many small wheels have to interdigitate. The initial process runs from the top downwards: increased solar radiation leads to more ozone and higher temperatures in the stratosphere. “The ultraviolet radiation share varies much more strongly than the other shares in the spectrum, i.e. by five to eight per cent, and that forms more ozone” explains Katja Matthes. As a result, especially the tropical stratosphere becomes warmer, which in turn leads to changed atmospheric circulation. Thus, the interrelated typical precipitation patterns in the tropics are also displaced.
The second process takes place in the opposite way: the higher solar activity leads to more evaporation in the cloud free areas. With the trade winds the increased amounts of moisture are transported to the equator, where they lead to stronger precipitation, lower water temperatures in the East Pacific and reduced cloud formation, which in turn allows for increased evaporation. Katja Matthes: “It is this positive back coupling that strengthens the process”. With this it is possible to explain the respective measurements and observations on the Earth’s surface."
"Solar irradiance variations are known to exhibit a strongwavelength dependence, with the amount of variability increasing towards shorter wavelengths (Lean 1991, Solanki & Unruh 1998). The integrated spectrum (total solar irradiance) changes by roughly 0.1% over the solar cycle. The same amount of variability is found for the visible wave-lengths where most of the solar radiative output occurs. Variations at UV and shorter wavelengths, however, exceed those at visible by orders of magnitude. Since solar UV radiation controls the amount of stratospheric ozone these variations have been proposed as a significant driver of changes of the terrestrial climate system (Haigh 1996)."
They also suggest the EUV under 300nm varies by the greatest amount over the cycle.
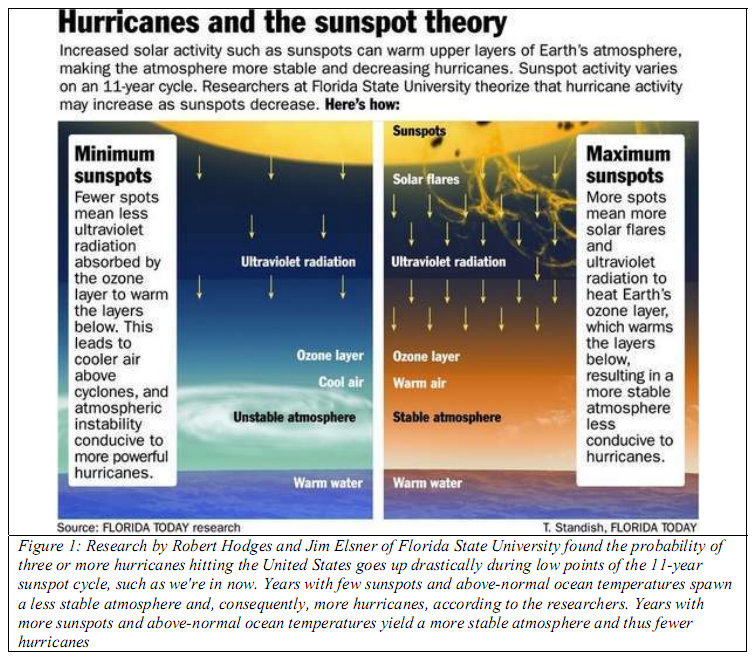
A new report by Robert Hodges and Jim Elsner expands on the UV/climate connection. Some interesting references to a 16% UV variation during solar flare activity (I knew I had seen the 16% figure previously) and also the polar vortex influences. Nicola Scafetta's new paper is also mentioned. http://icecap.us/images/uploads/Warming_Due_To_Ultraviolet_Effects_Through_Ozone_Chemistry.pdf
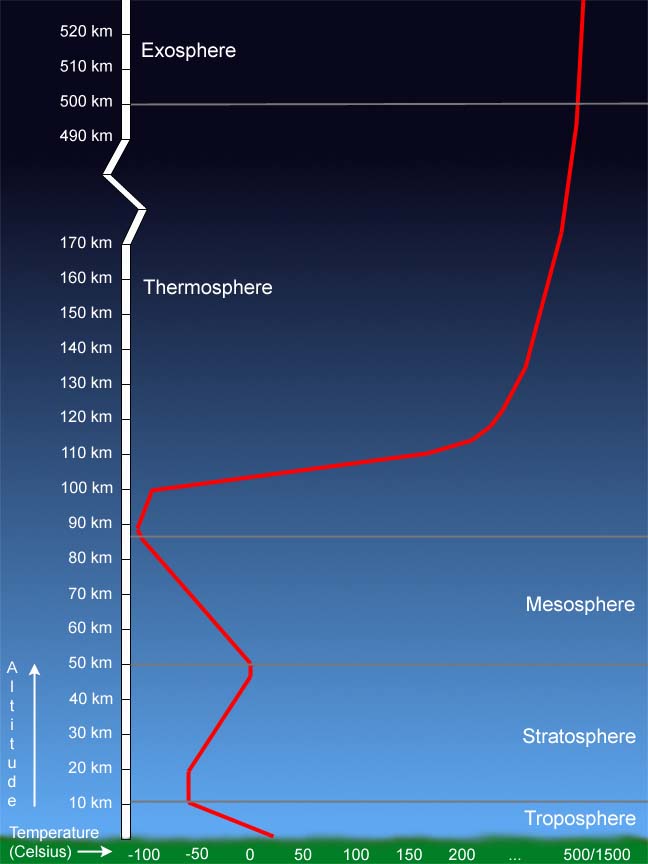
Earth's atmosphere may be broken up into multiple layers but each layer is part of a functioning overall system. The troposphere where we live (0-10km) is very much interlinked with all the layers above. Each layer receives different influences from the energy sources available, but interrelate as a whole, to form weather patterns experienced on the surface. When it comes to level 2 energies, the most variable are solar UV outputs, which have large potential to alter climate cycles.
Solar UV ranges from 10-400nm on the spectral scale and is broken up into 3 basic categories. EUV is at the extreme end of the spectrum (10-125.6nm) which includes the important Lyman alpha portion which resides at the high end of the EUV scale. EUV values vary by 30-100% across the range over the solar cycle, and have the most potential to modulate atmospheric chemistry, size and temperature. FUV (126-200nm) also shows big variations in the 10-30% range and is a very important player along with EUV for ozone formation in the stratosphere and mesosphere. MUV (200-300nm) is a solid ozone backstop but only varies 1% over the solar cycle but still relevant when comparing overall TSI (total solar irradiance) variance of 0.1%.
Those that subscribe to AGW science will only push TSI when it comes to solar influence on climate. The records gathered from somewhat dubious satellites during the space age display a small 0.1% change in solar HEAT output over a few solar cycles. To really appreciate the true solar effect on climate it is necessary to include chemical changes and total solar influenced cloud cover to see the real picture.
Beginning with the most variable component of solar output spectrum, EUV has only in the last few decades been studied in detail, and is now one of the areas where real dollars are spent in space exploration.
EUV is mainly consumed above 100km in the thermosphere where the air density is low. Some of the climate relevant reactions occur in this region producing atomic oxygen and nitric oxide that later play a large role in ozone formation/control at lower levels. In the EUV range there is an important lively band in the Lyman alpha range (125.6nm) that penetrates down to 70km. As seen in the above diagram different ranges of the UV spectrum are absorbed at different altitudes, the Lyman alpha range is particularly strong and produces large amounts of atomic oxygen down to 70km that is used in the formation of ozone in the mesosphere. Solomon (1982) and others show how this atomic oxygen is also pumped down to lower levels to further assist ozone production, the downward mechanism coming from eddy diffusion. EUV can produce species that build ozone but it can also produce large quantities of nitric oxide (NO), that destroys ozone. Nearly all NO is produced in the thermosphere, with the majority portion coming from EUV interaction. But, during times of high aurora activity a process called EPP (Energetic Particle Precipitation) can produce as much as 50% of the total NO production. Solar proton events and cosmic rays also play their part which all come under the general umbrella of solar modulation. Several authors including (Solomon, 1982) and a good overall reference HERE have shown that great quantities of NO are diffused down to the mesosphere and stratosphere where they have great influence in ozone formation (negative). The downward path coming from eddy diffusion and the downward flow to the northern polar vortex at the tale end of planetary and gravity waves. The ozone process is complex and little understood, but recent finds by Haigh are showing quantities of ozone can increase above 45km and decrease below during times of weak solar activity, which is no doubt brought about by the chemical changes that fluctuating EUV/FUV brings along.
Baldwin et al who are considered the experts in the QBO (stratospheric wind oscillation) speculate on the role of UV in the mesosphere and how modulation could play an important role in the break up of the northern polar vortex. The break down of the vortex is a key component of the AO index which is hard linked to the behavior of the jet stream.
“Because of the strong absorption of ozone in the UV occurring in the upper stratosphere and meso-
sphere, a solar influence on the thermal structure in these regions of the atmosphere is plausible. This, in
turn, might affect the strength of the planetary wave driven “extratropical pump” [Holton et al., 1995]. A
mechanism involving downward propagation of stratospheric anomalies, through modification of planetary
wave propagation from below, is discussed in section 6.2.”
Further to Baldwin there is a very comprehensive paper by Hood that discusses all of the atmospheric topics mentioned in this article. Hood and his references show a very strong link between varying solar EUV/FUV and stratospheric influence on tropospheric climate.
The jet stream changes which drive cold air from the polar regions has provided colder conditions for the past 3 years, any changes to cloud cover extent which is also proposed by harmonic drivers will further increase the influence from exterior sources.
The links between solar activity and climate remain controversial, but headway is being made to oppose some of the accepted science in this area. Similarly the planetary links to solar and PDO drivers are also making headway as more research comes to hand. Nicola Scafetta has already proposed a Harmonic Climate Model which deals with the level 3 oscillations. Nicola is very aware of the higher levels that need to be fully incorporated, which perhaps may happen in print in the not too distant future.
UPDATE Feb 9 2012: Some thoughts on why there is an increase in ozone above 45km and a decrease below during low solar output.
There have been some interesting observations in the last 2-3 weeks. The QBO entered its easterly phase at higher altitudes, 1.5 hPa zonal winds decreased sharply, NH polar ozone levels around 45km increased while the same region saw a drop in temperature, the AO went negative with an abrupt change in jet stream behavior that Europe is now witnessing via some fairly brutal weather. I think a large factor of these occurrences is solar induced through variance in EUV and FUV, could the ozone movements be a symptom and driver of this observation. If the QBO is favorable, and the below 45km area low in ozone via low solar output, planetary waves are allowed to move lower ozone to higher levels (esp polar regions). The migrated ozone can exist longer above 45km because there is less UV and nitric oxide available during low solar output which would normally restrict ozone.
Below is a table displaying the metrics involved in the "Great Winter Freeze of 2012"
Click on the images for a full size view
Great Winter Freeze of 2012 Metrics
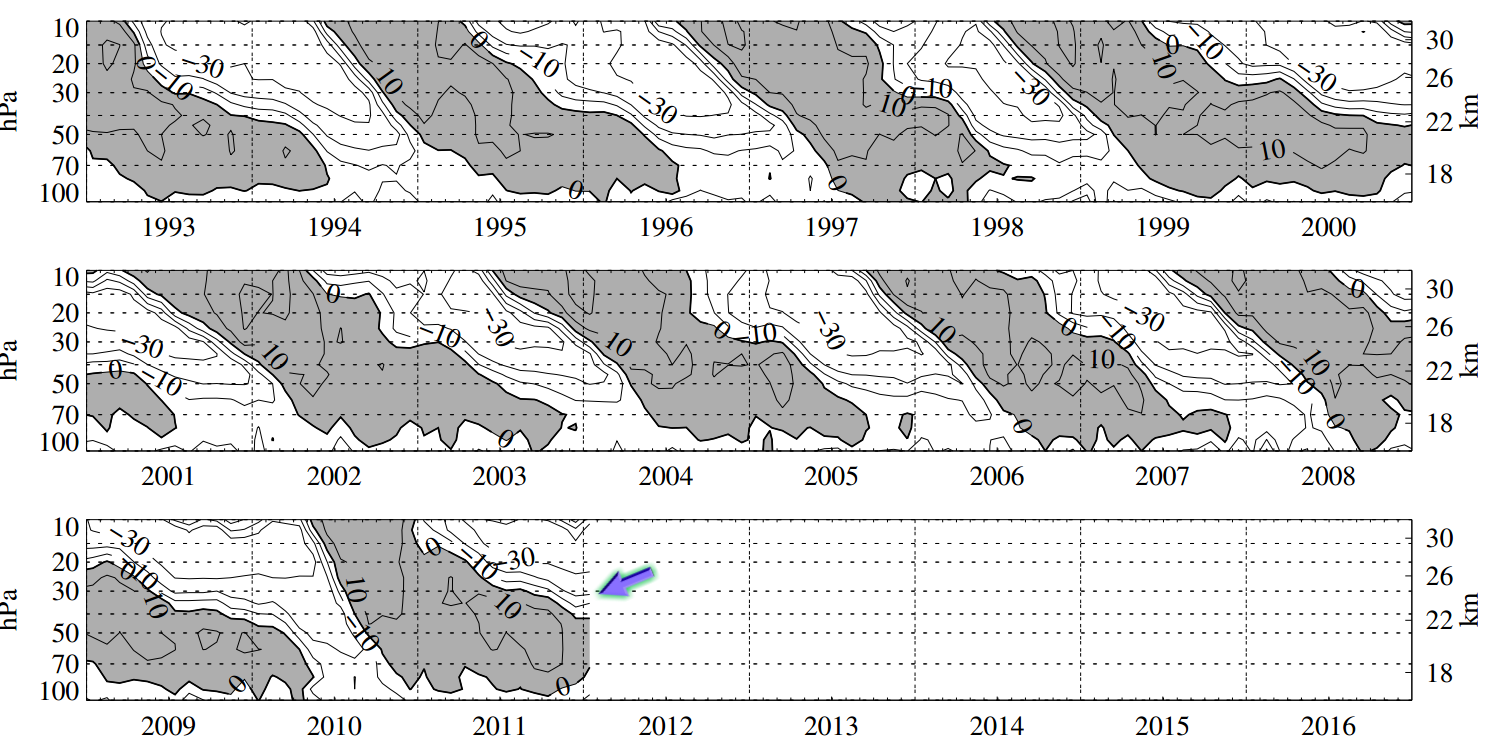
QBO diagram taken from the University of Berlin. The darker area is the westerly flow and the white area is the easterly flow. The break up of the northern polar vortex is the key to realizing a neg. AO. It is thought planetary waves traveling up from the equator to the pole is fundamental for this process. An easterly QBO encourages this process, which can be seen to be developing at higher altitudes.
Upper Stratospheric zonal winds show a sharp decline at the end of January. Baldwin et al and others suggest this is one factor required for the intrusion of the planetary wave to the polar regions. This metric showing the easterly phase of the QBO kicking in.Note: QBO easterlies are stronger during low solar output.
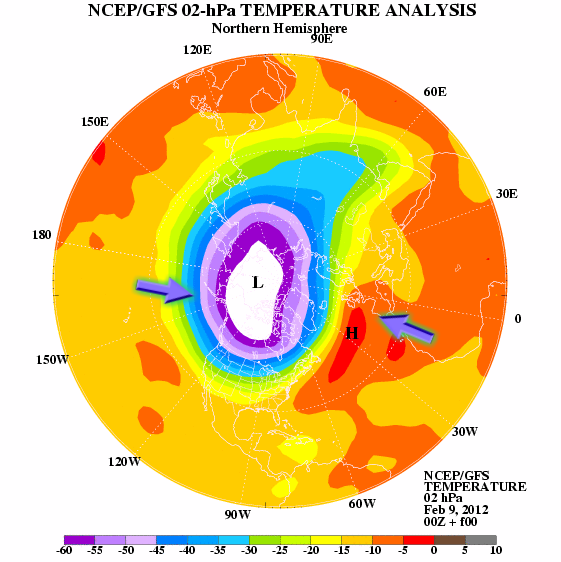
Upper Stratospheric temperatures have shown an overall cooling which is perhaps unexpected but when looking at the spatial patterns (next) there are also warm areas that are the signature of a collapsing polar vortex.
Upper Stratospheric temperatures shown in a different format show the distribution of temperature across the pole. Notice the warm area is over Europe. The temperature spatial patterns align with the ozone spatial zones.
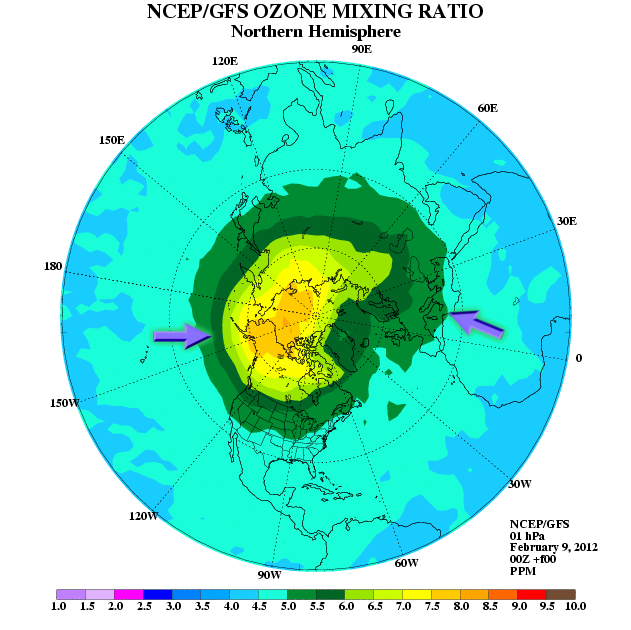
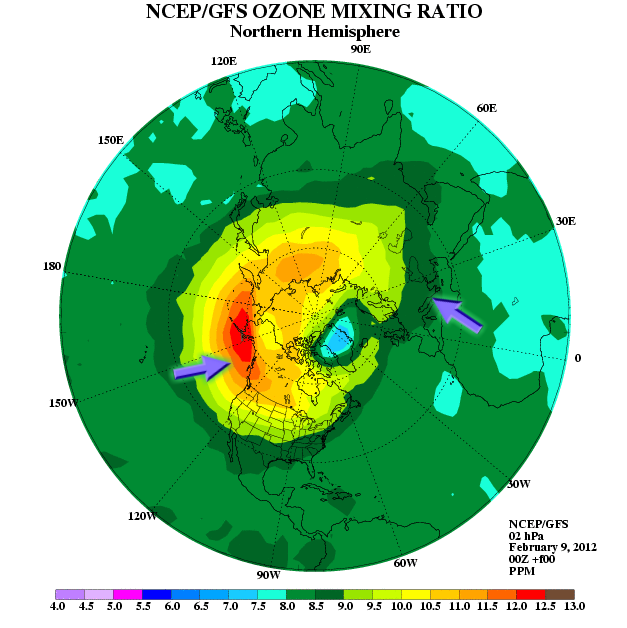
Upper Stratospheric polar ozone mixing ratio plots showing a distribution bias away from Europe. The higher ozone quantities are possibly from 2 sources. Low solar activity promotes less NOx activity which destroys ozone at higher levels, and ozone from lower levels is transported via the now productive planetary waves.
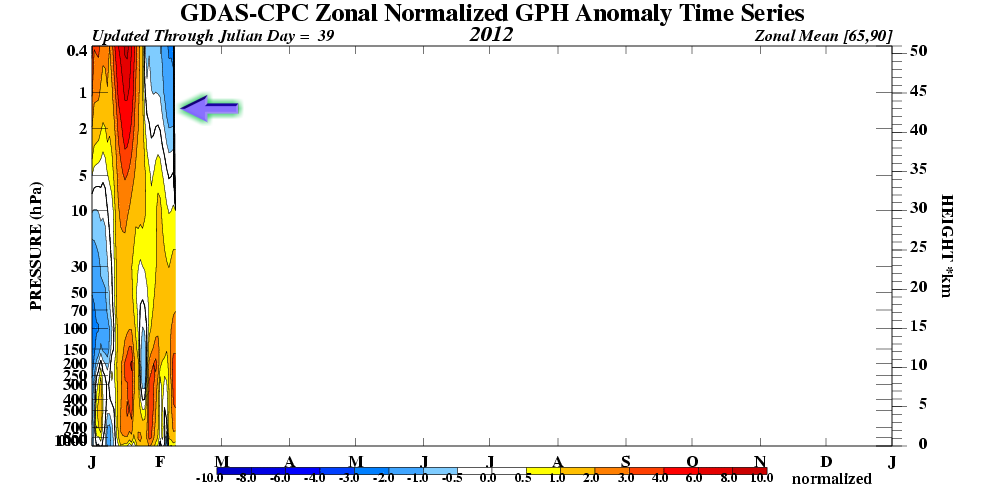
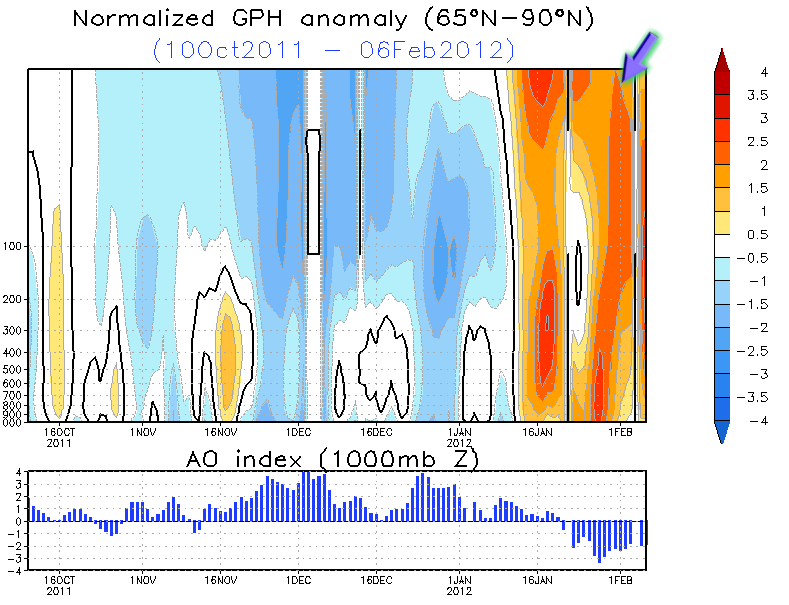
The all important northern hemisphere vortex graph along with the AO position showing the sudden weakening of the polar vortex (red) in January. Notice the slight lag in timing of the AO index. A negative AO changes pressure patterns at higher latitudes which influence the shape of the jet stream.
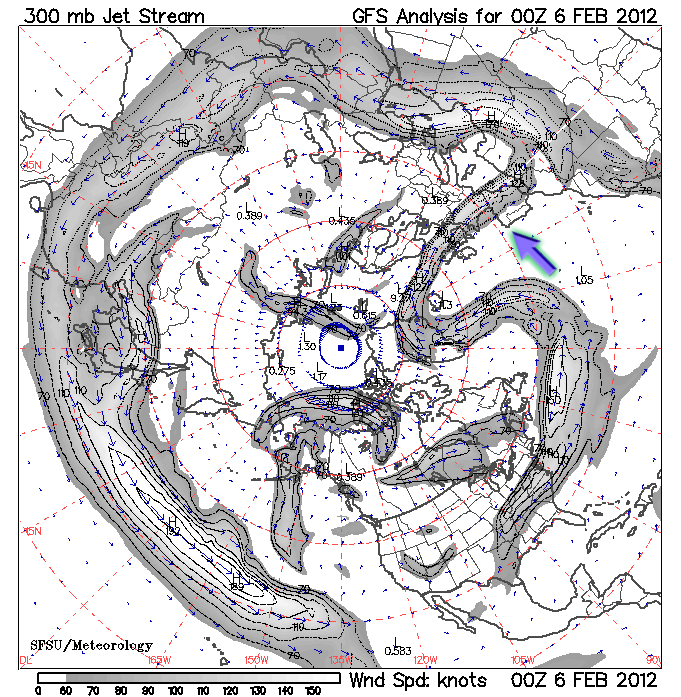
The end result felt at the surface. The negative AO changing the shape of the jet stream that now favors central and western Europe. Cold Arctic air is drawn down over Europe. Nearly all severe global weather events of the past few years are aligned with a jet stream climate forcing. The position of the AO and AAO in the south determining which part of the globe is affected.