Share
click on the graph for a larger view.
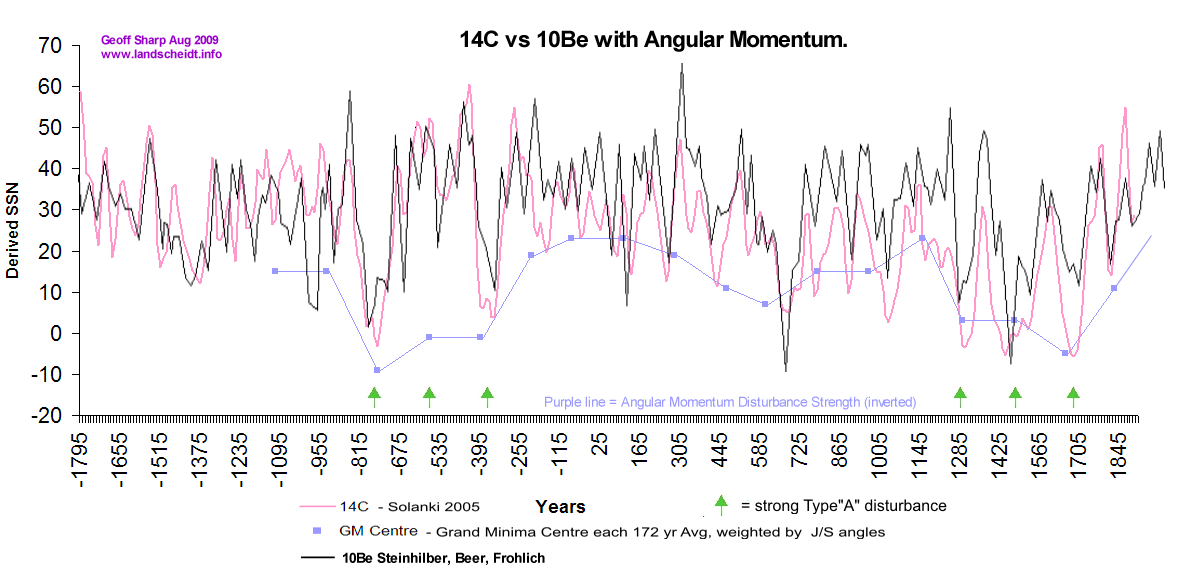
This is the first time Angular Momentum Disturbance Strength has been quantified and is depicted by the purple line in the above graph. This purple line shows how Angular Momentum Disturbance Strength is the driver of solar downturns, it is the background curve of the proxy records. The method used is a preliminary method using visual observation of each disturbance of the graph period. With the discovery of Carl's graph we are now able to easily see the different types of disturbance that comes in groups every 172 years average. These disturbances always line up with periods of solar downturn. 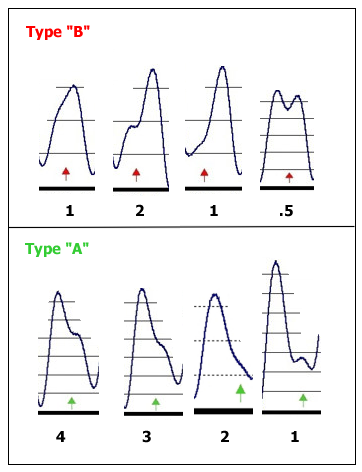 The Solanki/Steinhilber data shows regular solar downturns that vary in intensity, by observing the shapes of the disturbances that align with these downturns we are able to see a pattern that is repeatable. An example of this is the regular appearance of strong Type "A" disturbance occurring at times of severe grand minima. Weak Type "B" disturbance always is associated with very minor grand minima. There is no indication of this pattern not following suit except in the rare occasion of strong Type "A" disturbance not fully firing when not meeting the "Wilson's Law" test. This test states that for a disturbance to fire the Jupiter/Saturn opposition or conjunction must happen before cycle max. This has been tested over the Sunspot numbers but is not available for accurate testing beyond that as the cycle max is not known. 1830 and -530 are examples of this phenomena.
Described in previous articles Type "A" is nearly always stronger than Type "B" disturbances. Type "A" affecting the inner loop of the Sun's path around the SSB and Type "B" affecting the outer loop. The Sun's velocity is 100% higher when traveling the outer loop.
By matching the disturbance patterns with solar downturn strength I gave each disturbance a score. Disturbance's that align with deep grand minima (on a constant basis throughout history) get the highest score and so on. On the solar proxy graph at the top of this article I have recorded the strength of each disturbance group that comes along every 172 years average. This was achieved by scoring each individual disturbance and summing. The individual disturbances can be viewed at http://www.landscheidt.info/?q=node/5 and http://www.landscheidt.info/?q=node/1
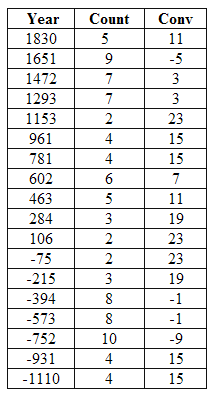
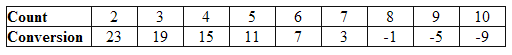
This table is a result of that process. The "Count" column being the sum of the individual disturbances for each 172 year centre. To plot this trend on the Solanki data it needs to be scaled and inverted. For the scale I tried to approximate the Solanki derived sunspot number and use a conversion process to do this within a set scale. For every increment of the "Count" I have associated it with 4 Solanki sunspots as seen on his graph. This gives a reliable method and displays the trend accurately. Once the conversion was done the data was entered into the Solanki spreadsheet.
Although the counting process is subject to the eye of the observer resulting in perhaps a slightly different Count, the overall trend will still be evident and should not vary greatly from my analysis. Future Counting could be performed more accurately by measuring the precise angles of the Jovians during individual disturbances and rating them according to a set scale. The ideal time to measure the angles is when Jupiter and Saturn are in opposition (measuring Neptune & Uranus angle in respect to Jupiter) for type "A" and when Jupiter and Saturn are at conjunction for type "B" disturbances. The position of the hump at disturbance is a direct result of the timing of Neptune and Uranus in respect to Jupiter.
Below is a table showing the conversion process.
The spreadsheets is available from http://www.landscheidt.info/images/solanki_sharp.xls
Wilson's Law
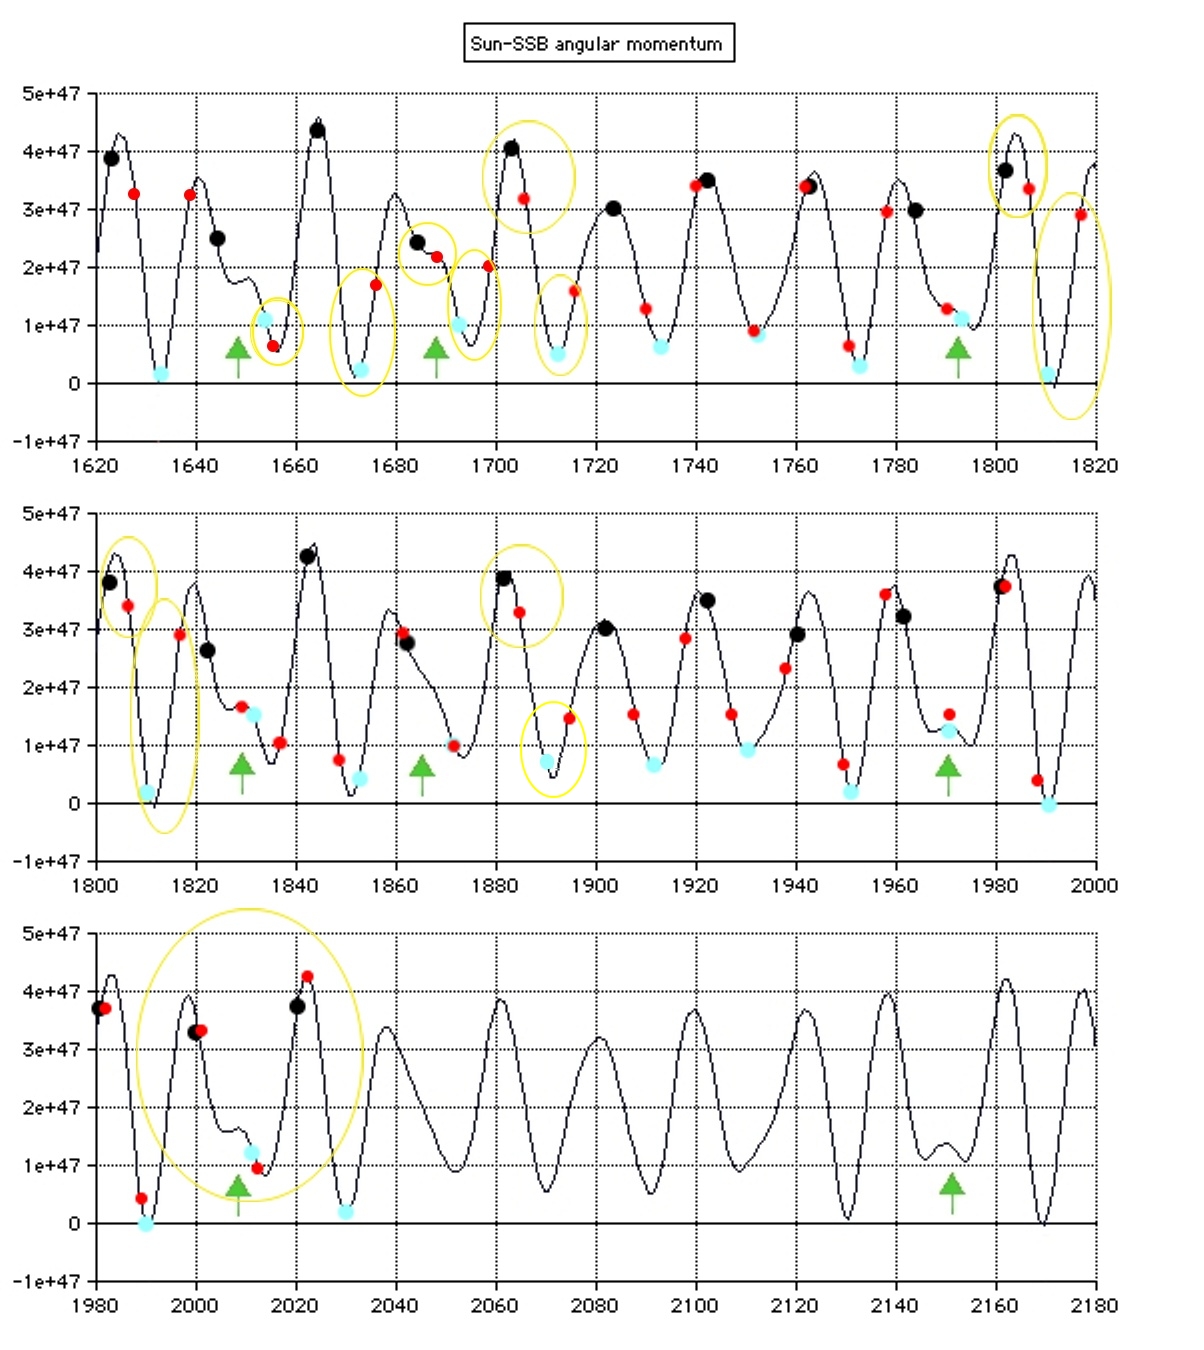
Black dots are J+S together, Blue dots J+S opposed, and Red dots are solar cycle maxima…..reduced solar activity occurs if we get a black or blue dot in between cycle minimum and before cycle maximum. 1830 not passing the test.