Share
The Carbon 14 record (14C) used as a solar proxy that is derived from the INTCAL98 project by Solanki and Usoskin is sometimes called into doubt. There have been attempts to cross check the results using Beryllium 10 (10Be) comparing running means over different time periods. But now we have a new report that produces 9300 years of 10Be data that can be compared with the 14C record. Initial results show a very promising match up.
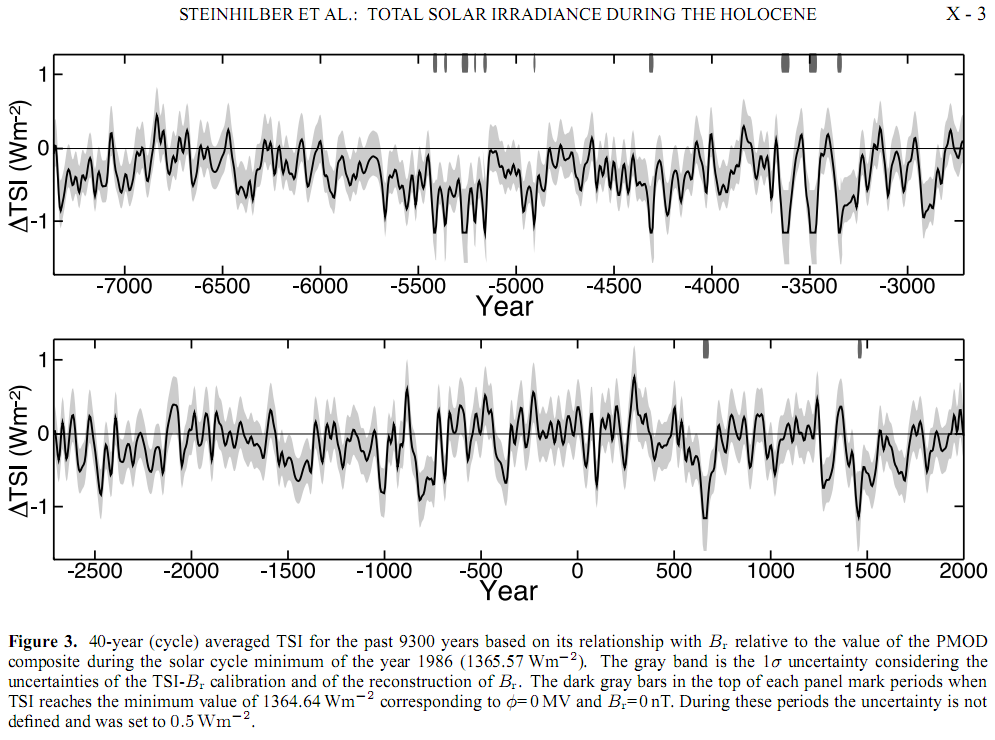
The new report which can be found here http://www.leif.org/EOS/Holocene-TSI.pdf shows one graph in particular that can be used to cross check the 14C record. Click on graphs for a full size view.
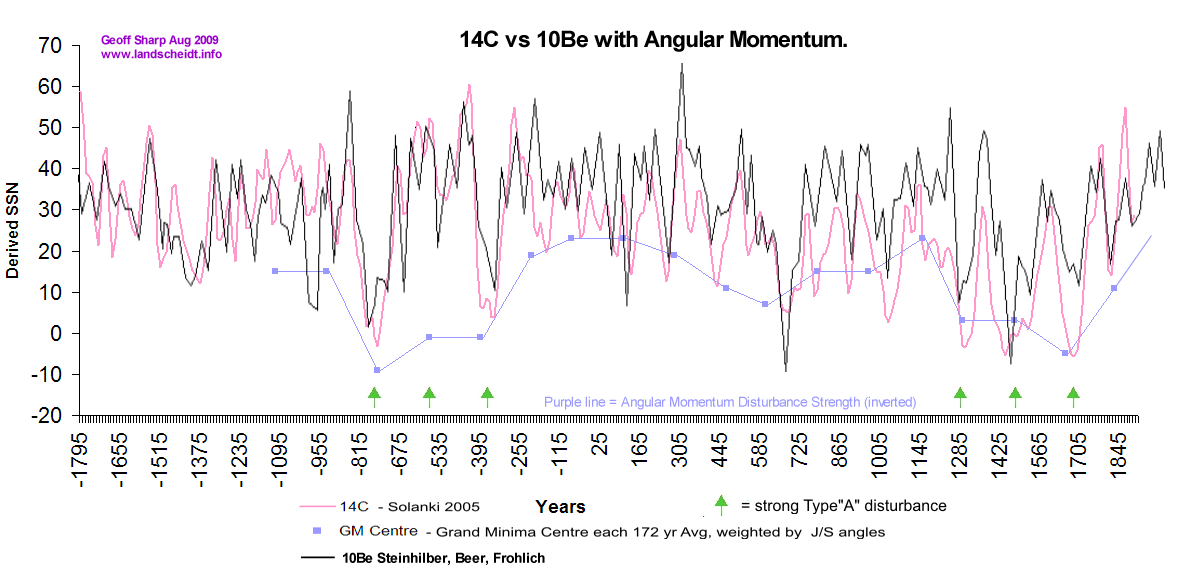
The comparison graph is a first pass and should be extended the full 9300 years and if possible the new data needs to be merged with Solanki's data in a spreadsheet. My method of comparison as follows: The 14C data is taken directly from the Solanki data and graphed via excel spreadsheet. The Steinhilber graph saved from the original document is traced onto a transparent gif image layer and saved then overlaid onto the original Solanki graph. The Steinhilber overlay is then rescaled for X & Y coordinates to match the original Solanki scale.
There are a few anomalies between the 2 data sets but overall a very good match is found. The 14C record is now confirmed with perhaps some minor anomalies but some confidence is expected. The planetary line ups with their disturbance to Angular Momentum that cause Grand Minima are now validated by another independent source.
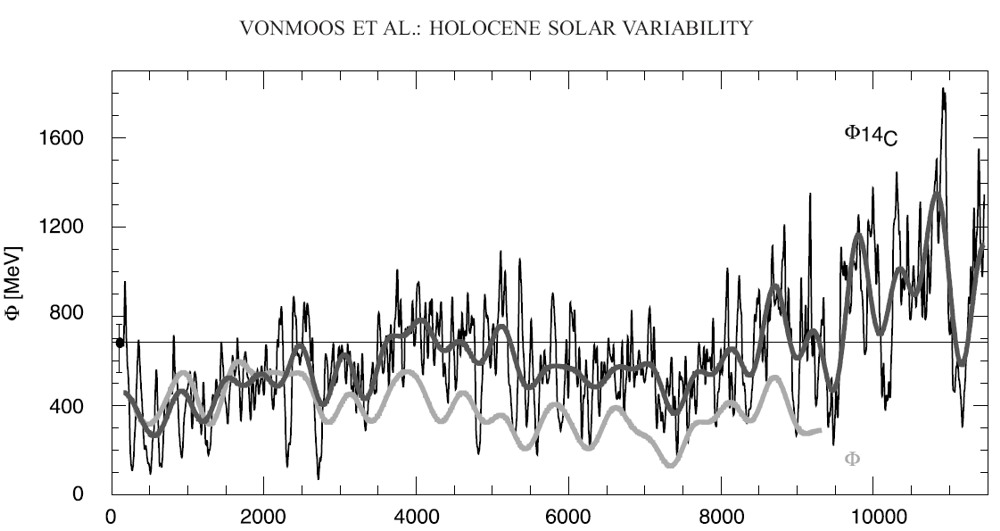
Vonmoos et al compares 10Be with 14C. Although fairly convincing the new data shows a new level of detail.
Note: This graph is in reverse compared with the other graphs in this article.
The Vonmoos 10Be graph and the recent Steinhilber overlay both display a "flatter" modulation of solar activity. The 14C showing more modulation. Does this give us a clue to whether TSI values have varied more than the 0.1% over recent times and more importantly how does the Babcock-Leighton model account for the now verified regular solar downturns? This simply cant happen if based on a random number generator.
The Landscheidt Minimum will answer many questions.