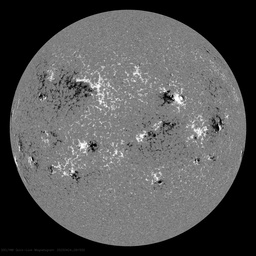
One region counted with overall area decreasing more. Region 1635 has quickly dissipated but it and other speck groups are bolstering the official sunspot figures in an artificial manner. The 27th was very close to being declared spotless according to the Wolf method. The LSC monthly average has been trending down for the past week, December should show a fairly steep decline in sunspot numbers.
Some new youtube videos outlining part 1 of my solar theory and an overview now available.
I am ramping up the twitter & facebook feeds that will include solar and climate news/graphs etc...click on the follow button near the top of this page or the left hand menu to be included. I have also added a new IceAgeNow news feed that is available from the left hand menu, making it easier to keep up with all the global cooling events that are missed by the mainstream media.
| LSC Daily |
Draw Ref. |
SIDC |
LSC Mov Avg. |
| 8 |
Locarno |
37 |
26 |
|

|
|
| NOAA Region # |
Pixels |
Darkness |
| 1638 |
672 |
58% |
| F10.7 flux |
DSN |
Date/Time UTC |
| 103.2 (109.3) |
778 (1513) |
2012/12/27 08:00 |
|
|
F10.7 flux is adjusted values measured at Penticton for the associated day @ 20:00 UTC. DSN = pixel area x darkness. Bracketed figures denote the previous measurement. Regions not included do not pass the 333 pixel threshold. The LSC daily is the SIDC discounted value less the groups that fail the threshold test and questionable group splits. The Drawing Ref. is the drawing used that day that can include in order of


