Share
|
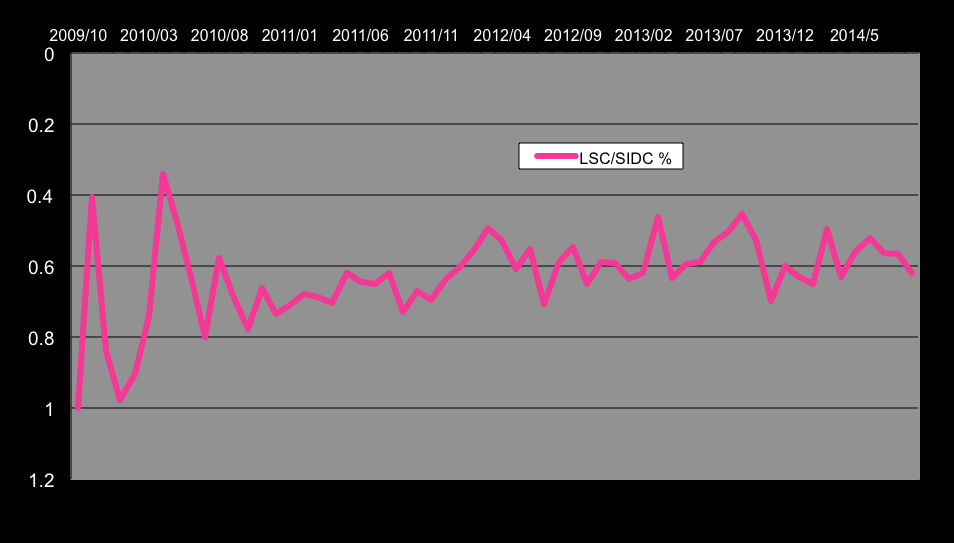
November Update: November was another mixed bag of overall low activity with 3 spotless days and other times with reasonably strong groups. The speck ratio was higher than last month and continues to demonstrate the higher proportion of small spots to large spots during SC24. The LSC was measured at 36.2, SIDC 61.4, NOAA unadjusted at 89.2 (prov). The SIDC for the 20th straight month over counting compared with NOAA.The SIDC/NOAA and LSC/SIDC comparison graph showing a growing difference with the general trend continuing to rise over SC24. with reasonably strong groups. The speck ratio was higher than last month and continues to demonstrate the higher proportion of small spots to large spots during SC24. The LSC was measured at 36.2, SIDC 61.4, NOAA unadjusted at 89.2 (prov). The SIDC for the 20th straight month over counting compared with NOAA.The SIDC/NOAA and LSC/SIDC comparison graph showing a growing difference with the general trend continuing to rise over SC24.
A copy of the Layman's spreadsheet can be found HERE.
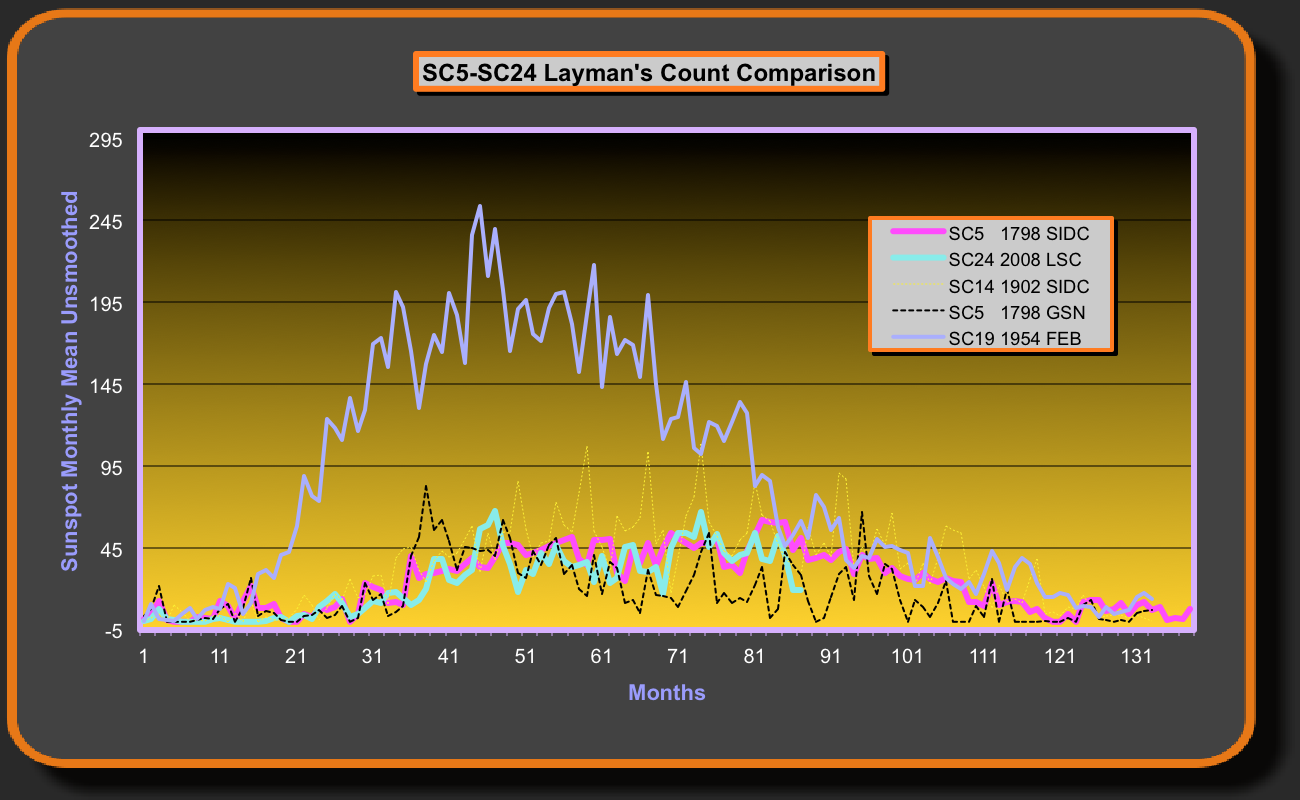
SC24 is still on track to matching SC5.
|
Three regions counted with overall area increasing a small amount. I am still typing from my keyboard, but we have a few hours to go.
Some new youtube videos outlining part 1 of my solar theory and an overview now available.
I am ramping up the twitter & facebook feeds that will include solar and climate news/graphs etc...click on the follow button near the top of this page or the left hand menu to be included. I have also added a new IceAgeNow news feed that is available from the left hand menu, making it easier to keep up with all the global cooling events that are missed by the mainstream media.
| LSC Daily |
Draw Ref. |
SIDC |
LSC Mov Avg. |
| 33 |
Manual |
- |
26 |
|

|
|
| NOAA Region # |
Pixels |
Darkness |
| 1634 |
1320 (1461) |
52% (56%) |
| 1635 |
20 (1753) |
56% (55%) |
| F10.7 flux |
DSN |
Date/Time UTC |
| 110.4 (109.8) |
3444 (3486) |
2012/12/20 08:00 |
|
|
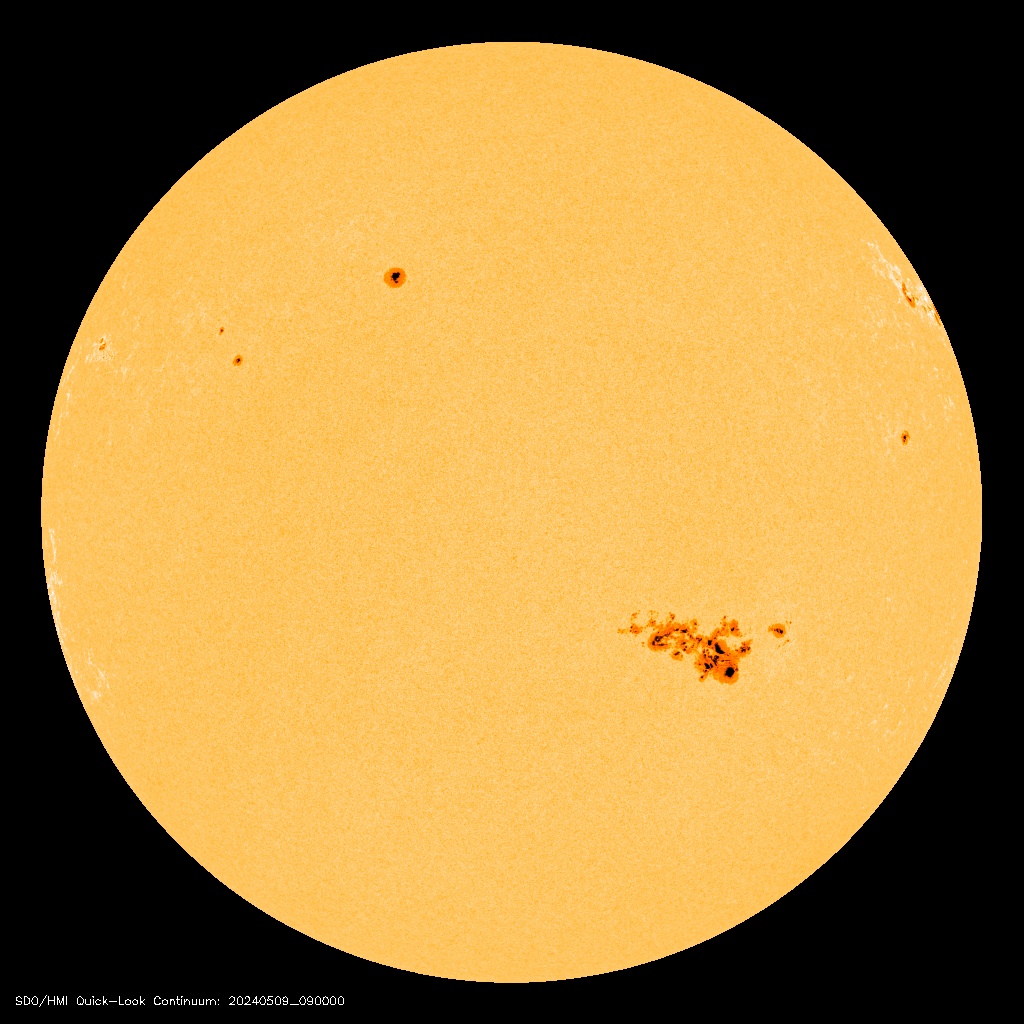
F10.7 flux is adjusted values measured at Penticton for the associated day @ 20:00 UTC. DSN = pixel area x darkness. Bracketed figures denotes the previous measurement. Regions not included do not pass the 333 pixel threshold. The LSC daily is the SIDC discounted value less the groups that fail the threshold test and questionable group splits. The Drawing Ref. is the drawing used that day that can include in order of preference Locarno, Catania and if both are not available the SDO image and a manual count (Waldmeier method). If available the SIDC value is Locarno x 0.6 (or Catania x 0.55). The LSC Avg. is the running average LSC for the current month. More Daily/Monthly records below. Click on the solar thumbnail for a full sized view.
| Cycle 24 record sunspot area: Region 1520 @ 28912 pixels on 10th July 2012. |
Main graphs updated monthly as soon as the LSC number is calculated (click graphs for full size)
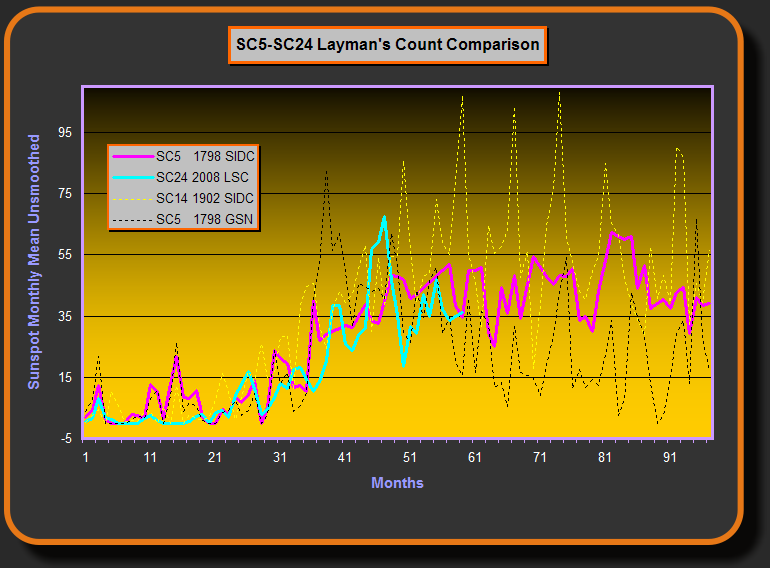
My predictions show that SC24 will be similar to SC5. The same Solar system forces are in play at similar timings and strength (SC24 perhaps showing a stronger disruption strength, which indicates that SC24 should be a smaller cycle than SC5). This graph using the SIDC monthly count from Jan 1798 will compare the Layman's Count from Jan 2008. The Layman's Count is the only count that can properly compare with the old SIDC (Wolf) measures. SC14 has been added for interest (starts Jan 1901) along with the GSN value from Hoyt & Schatten's alternative count which offers another comparison. All 4 records beginning at the end of their previous cycle (where the downramp meets the bottom). The unsmoothed numbers showing the big swings in SC14.
This is the first time modern science can measure a possible grand minimum...we might find that grand minima are simply one hemisphere closing down. Will there be enough sunspot activity in the south to allow the transportation of the reversing flux necessary for a polarity change?...lets see how it pans out.
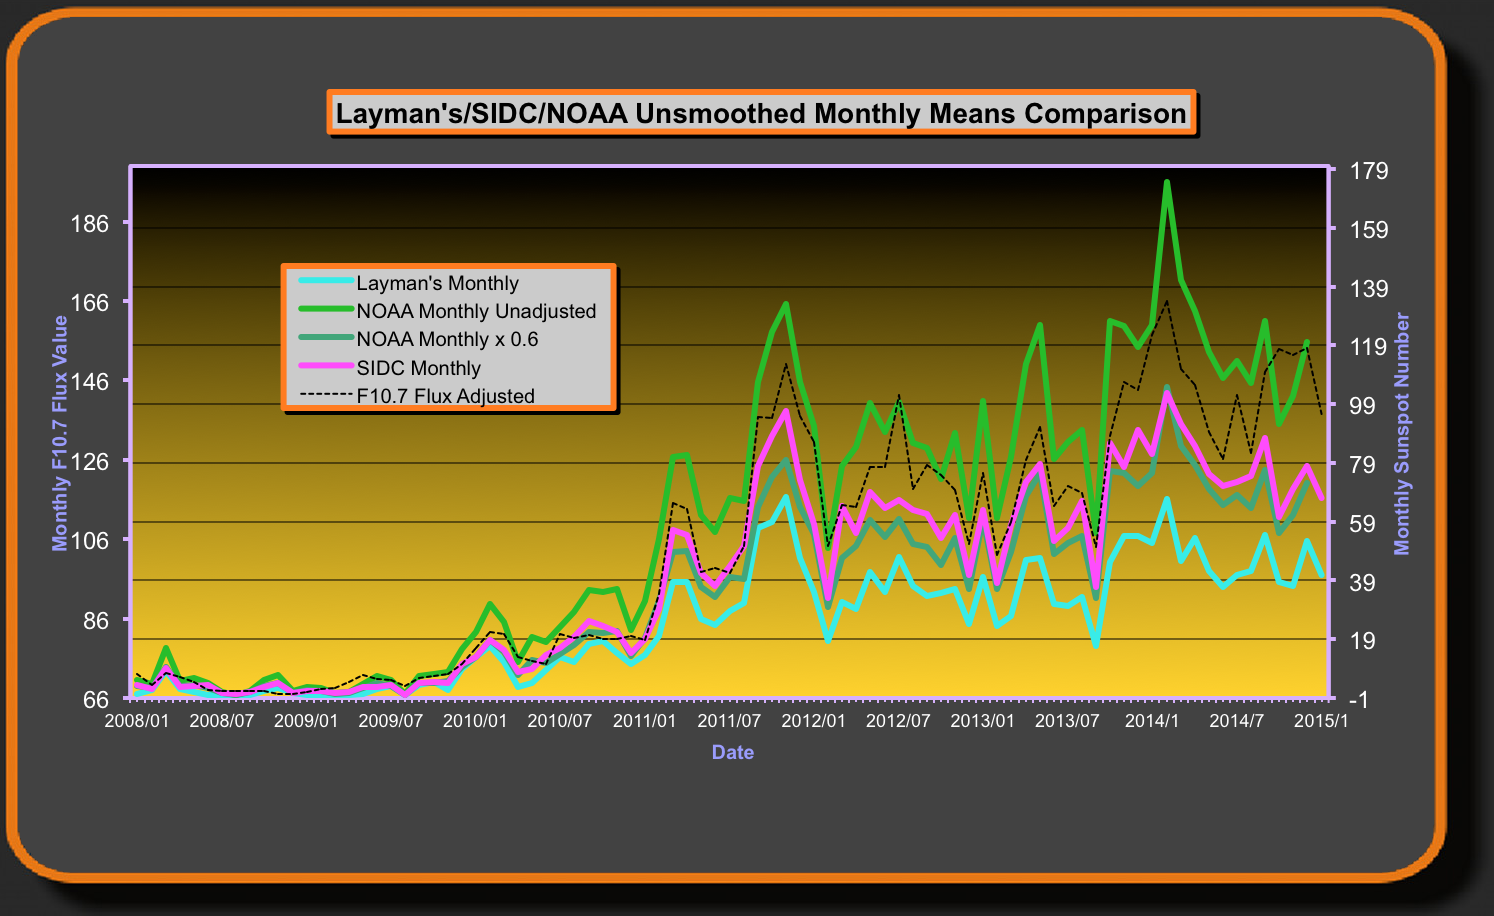
The Monthly comparison graph showing the different counting methods. The NOAA method departing from the Wolfer method by not adjusting the raw count (NOAA do not multiply by 0.6). The SIDC using the Wolfer formula (along with the Waldmeier scale factor) which I believe is flawed during times of high speck ratio.
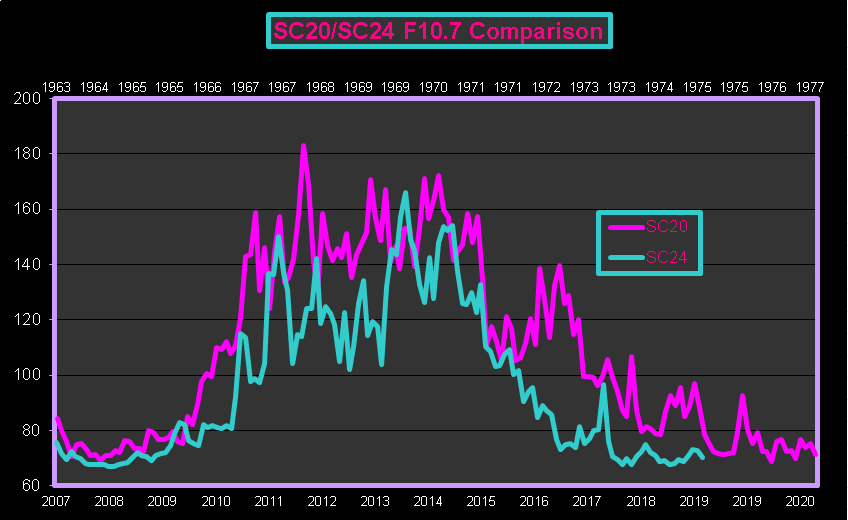
SOLAR CYCLE 20/24 F10.7 FLUX COMPARISON.
To compare solar cycles we can also use the F10.7 radio flux values that have been recorded since 1947 in Canada. Solar cycle 20 was a weak cycle which is currently looking strong against solar cycle 24. Data is taken from the AU adjusted monthly average values.
SC20 & SC24 have a lot in common, they both experience angular momentum disturbance measured at the Sun. SC24 has a much higher degree of disturbance that will guarantee a lower cycle than SC20 if the theory is correct.
Updated Monthly.
SC24 SPECK RATIO
Below is the current speck ratio for solar cycle 24. Because the LSC employs a similar to Wolf spot threshold size to weed out the smaller groups we can calculate the difference between the SIDC values and obtain a speck ratio. This speck ratio only applies to groups that don't pass the threshold and do not apply to groups that pass and have a multitude of specks. These specks are still counted. Wolfer when he changed the system applied a 0.6 factor to his count because he was counting all specks and needed to stay aligned with Wolf. As we can see the speck ratio is already exceeding Wolfer's conversion factor and the LSC is still counting specks in groups that pass. So in reality the speck ratio is much higher. This is solid evidence that the Wolfer reduction factor used extensively today is not capable of aligning with the original Wolf count. The speck ratio is increasing during what is looking like a grand minimum type cycle.
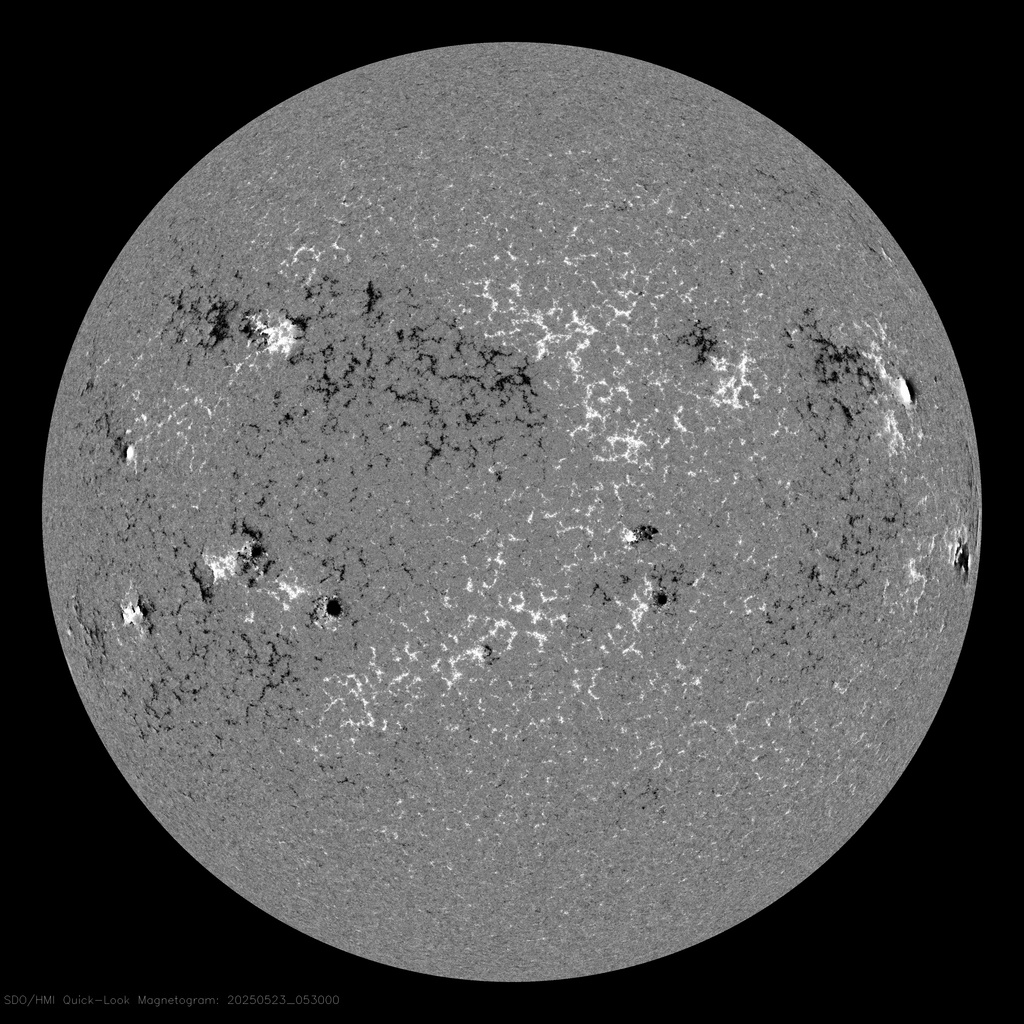
LAYMAN'S SUNSPOT DARKNESS RATIO
This ratio is a little like the Livingston & Penn contrast measurements, the L&P method is to measure the darkest part of the spot and compare it with the photosphere to achieve a contrast figure. The Layman method is to use only sunspot groups that make the grade and then measure how many green channel pixels are in the 0-132 pixel range and then calculate the proportion of that darker area over the entire pixels in that group . The Layman's method is not hampered by available telescope time, cloud cover and daytime only viewing, but uses the daily SDO images. The older SOHO values pre March 2010 have been calibrated to fit the SDO scale. So far the Layman's results are in direct contrast to the L&P.
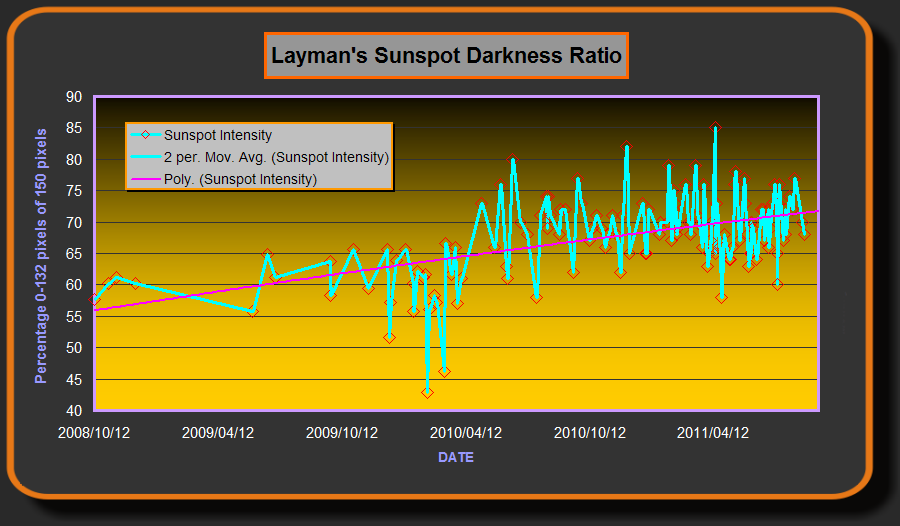
Click on the graph for